
Empirical Rule Custom Zone Calculator
Results
A custom zone is any interval between two SD boundaries, like −3σ to −1σ, and the Empirical Rule helps approximate the percentage of data in that zone. This empirical rule zone calculator lets you define segments like −2σ to −0.5σ or 0 to +1.3σ and see their approximated probability. It focuses on custom zones, making it perfect for students, educators, and visual learners breaking the bell curve into sections. Enter the mean, SD, and boundaries to see the probability now—who benefits? Anyone visualizing distribution segments!
What Are “Custom Zones” in the Empirical Rule?
A zone is any interval between two SD boundaries, like −3σ to −1σ. Custom zones let you slice the bell curve into specific segments for analysis.
Examples:
−3σ to −1σ
−1σ to +2σ
+2σ to +3σ
These zones represent specific “slices” of the normal distribution.
Useful for visualizing distribution breakdowns.
Empirical Rule approximates by segmenting large intervals.
How the Empirical Rule Estimates Zone Probabilities
The Empirical Rule gives probability for large blocks:
±1σ = 68%
±2σ = 95%
±3σ = 99.7%
By subtracting and segmenting these, we approximate smaller zones.
Examples:
−2σ to −1σ ≈ (95% − 68%) / 2 = 13.5%
+2σ to +3σ ≈ (99.7% − 95%) / 2 = 2.35%
This approximation process is clear for custom normal distribution sections.
How the Custom Zone Calculator Works
The tool is flexible:
Enter Lower SD Boundary: e.g., −3σ.
Enter Upper SD Boundary: e.g., −1σ.
Get Results: Probability (e.g., 15.85%), shaded zone on bell curve, SD boundaries.
The tool checks overlaps with rule intervals and subtracts areas. Supports zones between −3σ and +3σ.
Example Custom Zones (With Explanations)
Example 1: From −3σ to −1σ
Breakdown:
(−3σ to −2σ) ≈ 2.35%
(−2σ to −1σ) ≈ 13.5%
Combined Probability ≈ 15.85%
Example 2: From −1σ to +2σ
Breakdown:
(−1σ to +1σ) = 68%
(+1σ to +2σ) ≈ 13.5%
Combined Probability ≈ 81.5%
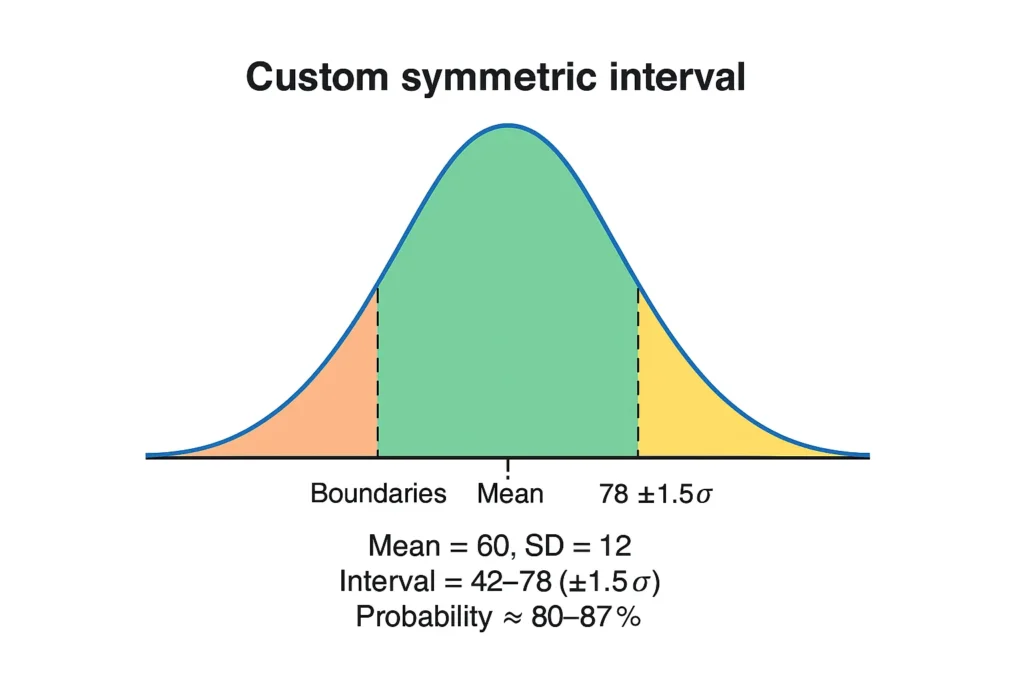
Example 3: From +1σ to +1.5σ (Custom)
Use Interpolation:
(13.5% / 1σ block) × 0.5 ≈ 6.75%
Probability ≈ 6.75%
Why Custom Zones Are Useful
Helps teachers explain normal distribution composition.
Ideal for creating banded grading systems.
Useful for understanding quality control thresholds.
Helps students visualize how probability accumulates across SD regions.
Allows creation of category zones (low, medium, high performance).
Perfect for infographics or classroom diagrams.
Example Categories: Performance zones, medical measurement zones, risk-level zones.
Limitations of Custom Zone Approximations
Works only for normal distributions.
Uses empirical rule → approximate.
Cannot compute exact probabilities for unusual intervals.
For precision, use z-table or normal CDF.
This transparency builds trust.
FAQs
Any interval between two SD boundaries, like −3σ to −1σ, approximated for probability.
By subtracting and segmenting rule intervals (e.g., 95% – half of 68% = 81.5%).
The rule’s 68-95-99.7% are rounded; exact values need z-tables.
No—this tool is for single zones. For multiple, calculate each separately.
No—it’s for normal distributions only. Skewed data needs other methods.
It’s an empirical approximation for teaching; precise values use math functions.
Related Tools
Empirical Rule Calculator: Core rule calculations
Empirical Rule Range Probability Calculator: For any range
Understanding Range Probability in the Empirical Rule: Learn more
Empirical Rule Middle % Probability Calculator: Middle percentages
Empirical Rule Symmetric Interval Calculator: Symmetric intervals
Conclusion
The empirical rule custom zone calculator makes custom empirical rule zones easy, showing probabilities for segments like −3σ to −1σ or +2σ to +3σ in normal distributions. With examples from IQ to test scores, you’ve seen its value for learning distribution sections. This tool is ideal for students, teachers, and analysts exploring bell curve zone calculator. Want to break your distribution into custom learning or grading zones? Use our Empirical Rule Custom Zone Calculator now to instantly approximate each segment’s probability.
Z-Score to Graph Plotter
Plot Z-scores on a bell curve and see where your value lies. Understand percentiles and probabilities at a glance.
Try CalculatorEmpirical Rule Percentile Calculator
Quickly estimate percentiles in a normal distribution using the 68-95-99.7 rule. Input mean, standard deviation, and a score to find its percentile rank.
Try CalculatorPercentile Rank Calculator
Find your score’s percentile rank without needing mean or standard deviation. Input your score and rank to see where you stand in any dataset.
Try CalculatorNormal Distribution to Percentile Visualizer
Visualize your score on a bell curve with shaded percentile areas. Enter mean, standard deviation, and a score to see its rank in a normal distribution.
Try Calculator