
Z-Score Graph Plotter
Results
Enter z-score values and click "Plot Graph" to see the results.
A z-score tells you how far a data point is from the average in a normal distribution, and our z-score to graph plotter brings this concept to life by plotting it on a bell curve. This tool lets you input a z-score or raw data value, along with the mean and standard deviation, to visualize its position on a standard normal distribution graph. Perfect for students, educators, and analysts, this tool makes it easy to see where data points fall and calculate percentiles. This guide explains z-scores, how to use the plotter, and why visualization matters. Curious to explore? Start with our main statistics tool to see data distributions in action.
What Is a Z-Score?
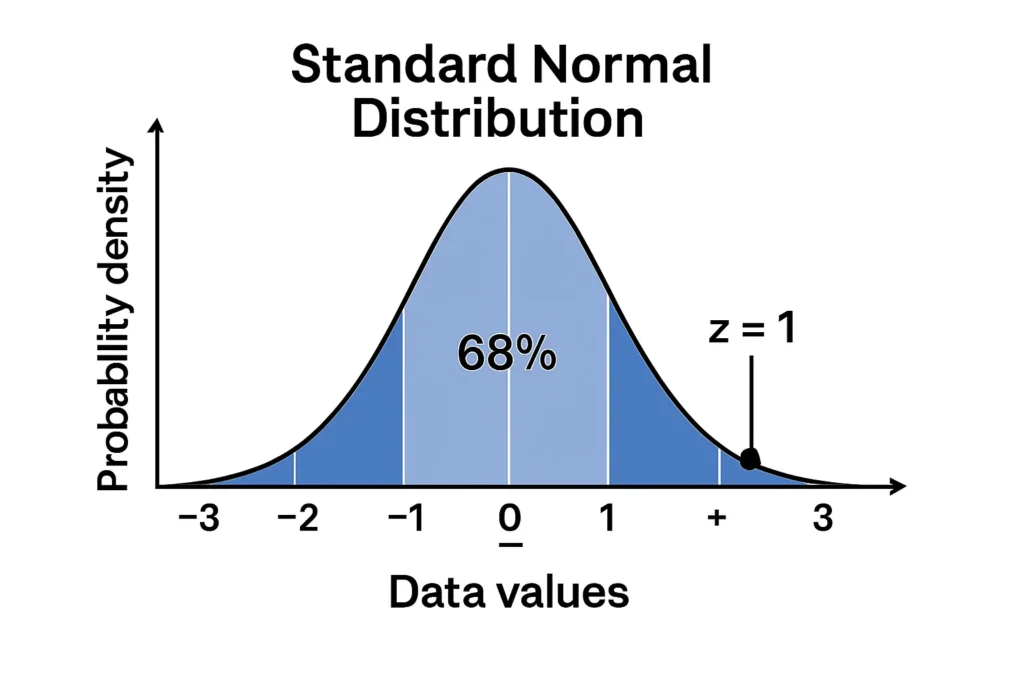
A z-score measures how many standard deviations a data point is from the mean in a normal distribution. It’s calculated as:
[ Z = \frac{x – \mu}{\sigma} ]
Where:
x is the data point.
μ (mu) is the mean (average).
σ (sigma) is the standard deviation, showing data spread.
For example, if test scores have a mean of 80 and a standard deviation of 5, a score of 85 has a z-score of (85 – 80) / 5 = 1, meaning it’s one standard deviation above the mean. A z-score visualizer helps you see this position on a bell curve, making it easier to understand data relative to the average.
How the Z-Score Graph Plotter Works
The z-score to graph plotter is a simple tool to plot z-score on normal curve. Here’s how to use it:
Enter the Mean (μ): Input the average of your dataset (e.g., 80 for test scores).
Input the Standard Deviation (σ): Enter the standard deviation (e.g., 5).
Enter the Data Point or Z-Score: Input either a raw value (e.g., 85) or a z-score (e.g., 1). The tool converts raw values to z-scores automatically.
Generate the Graph: Click “Generate” to plot the z-score on a bell curve. The tool shows the data point’s position and can shade area under curve z-score to indicate probabilities or percentiles.
Customize (Optional): Highlight specific areas, like the region below or above the z-score, to see percentages.
Example: For a test score of 90 with a mean of 80 and standard deviation of 10, the z-score is (90 – 80) / 10 = 1. The plotter places this point one standard deviation above the mean, shading the area below to show the percentile from z-score (about 84%).
Why Visualizing Z-Scores Matters
Visualizing z-scores with a z-score bell curve offers several benefits:
Clarifies Data Position: Shows how far a value is from the mean, making it easier to interpret outliers or typical values.
Estimates Percentiles: The shaded area under the curve indicates the percentage of data below a z-score, useful for ranking.
Enhances Learning: Helps students grasp statistical concepts through clear, interactive visuals.
Supports Analysis: Analysts can assess data significance in fields like education or finance.
For example, a teacher might plot a student’s z-score to show their rank in a class, while a researcher could visualize measurement deviations. Explore more with our graph generator or curve plotter.
Real-Life Use Cases
The z-score visualizer is practical in many scenarios:
Use Case 1: Academic Performance
A class’s exam scores have a mean of 75 and a standard deviation of 8. A student scores 83, giving a z-score of (83 – 75) / 8 = 1. Plotting this on the graph shows the score is one standard deviation above the mean, in the top 16% (since 84% of data is below z = 1). This helps teachers identify high performers.
Use Case 2: Quality Control
A factory produces bolts with a mean length of 10 cm and a standard deviation of 0.2 cm. A bolt measuring 10.4 cm has a z-score of (10.4 – 10) / 0.2 = 2. The plotter shows this is in the top 2.5%, flagging it as a potential outlier for inspection.
Use Case 3: Health Metrics
Blood pressure readings have a mean of 120 mmHg and a standard deviation of 10 mmHg. A reading of 140 mmHg has a z-score of (140 – 120) / 10 = 2. The graph shows this is unusually high, in the top 2.5%, aiding medical assessments.
FAQs
It’s a tool that plots a z-score on a standard normal distribution graph, showing its position on a bell curve and related percentiles.
A z-score shows how far a data point is from the mean in standard deviations, and the z-score bell curve visualizes this position.
You need the mean, standard deviation, and either a data point or z-score to plot on the normal distribution graph.
Yes, it can shade area under curve z-score to show the percentile from z-score, like the percentage of data below a value.
It visualizes where data points fall in a normal distribution, aiding in understanding rankings or outliers.
