
Empirical Rule Percentile Calculator
Z-Score
Percentile
Empirical Rule Classification
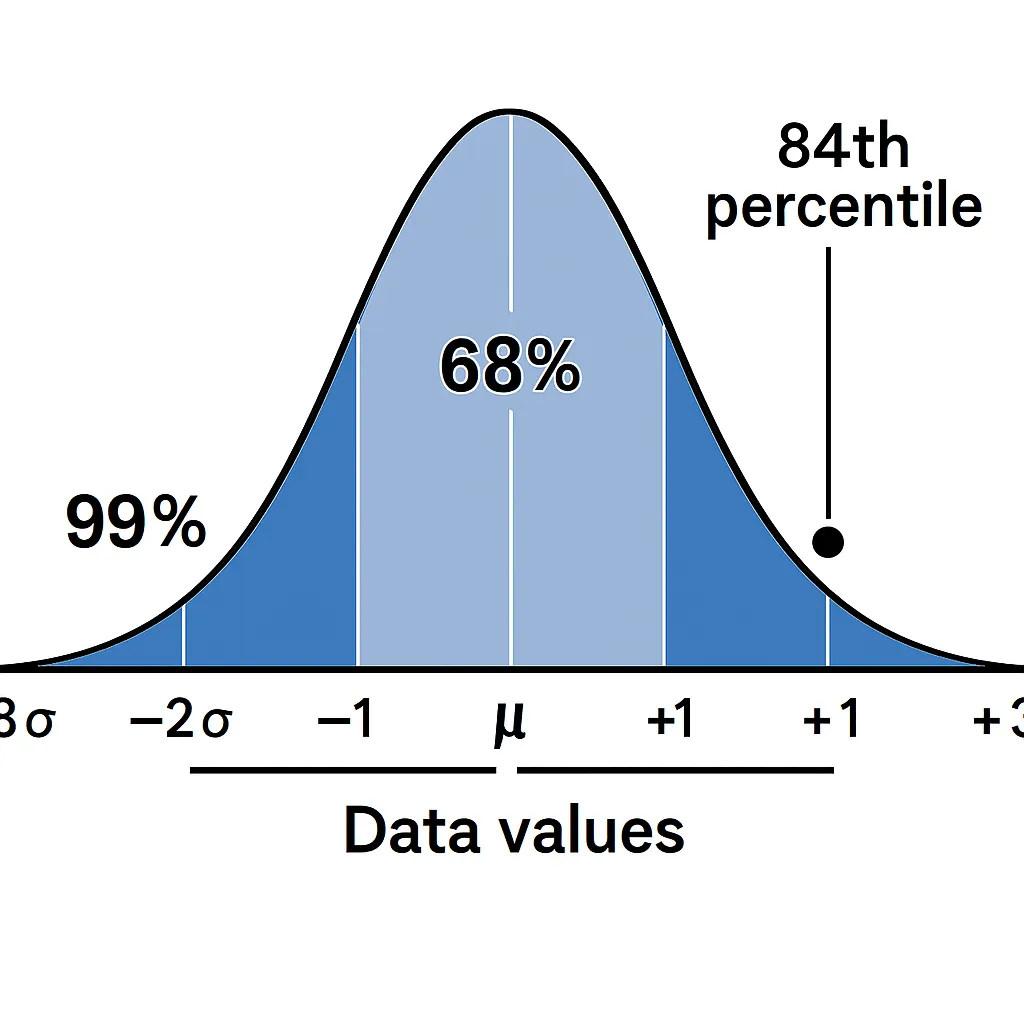
Normal Distribution Visualization
About the Empirical Rule
68% Rule
68% of data falls within 1 standard deviation (μ ± σ)
95% Rule
95% of data falls within 2 standard deviations (μ ± 2σ)
99.7% Rule
99.7% of data falls within 3 standard deviations (μ ± 3σ)
The empirical rule percentile calculator is a user-friendly tool that helps you estimate percentiles in a normal distribution using the 68-95-99.7 rule. By entering a dataset’s mean and standard deviation, you can quickly find the percentile rank of a specific value, showing where it stands relative to others. This tool is perfect for students, teachers, and analysts working with data like test scores or heights. In this guide, we’ll explain how the calculator works, provide a practical example, and explore its benefits. Want to dive into data analysis? Try our main statistics calculator to get started.
What Is the Empirical Rule?
The empirical rule, also called the 68-95-99.7 rule, describes how data spreads in a normal distribution, which forms a bell-shaped curve. It states:
68% of data falls within one standard deviation (±1σ) of the mean (μ).
95% falls within two standard deviations (±2σ).
99.7% falls within three standard deviations (±3σ).
This rule is key for estimating percentile from standard deviation, as it helps determine what percentage of data lies below a specific value. For example, in a normal distribution, a value one standard deviation above the mean is at the 84th percentile (50% below the mean + half of the 68% within ±1σ). To learn more about percentiles, explore percentile concepts.
How This Percentile Calculator Works
The empirical rule percentile calculator simplifies finding percentiles in a normal distribution. Here’s how to use it:
Enter the Mean (μ): Input the average of your dataset. For example, a mean of 70 for exam scores.
Input the Standard Deviation (σ): Enter the standard deviation, like 5, to show data spread.
Enter the Data Value: Input the value you want to find the percentile for (e.g., a score of 75).
Calculate the Z-Score: The calculator computes the z-score: ( Z = \frac{x – \mu}{\sigma} ). For a score of 75, with μ = 70 and σ = 5, the z-score is (75 – 70) / 5 = 1.
Estimate the Percentile: Using the 68-95-99.7 rule percentile, the calculator estimates the percentile based on the z-score. A z-score of 1 corresponds to the 84th percentile.
View Results: The tool displays the percentile and may show a visual of the bell curve with the shaded area below the value.
This process makes it easy to estimate percentile normal distribution. For precise conversions, try a z-score tool.
Example Use Case
Imagine you’re a teacher analyzing exam scores with a mean of 80 and a standard deviation of 10. A student scores 90, and you want to find their percentile rank.
Step 1: Input mean = 80, standard deviation = 10, and score = 90 into the calculator.
Step 2: The calculator computes the z-score: (90 – 80) / 10 = 1.
Step 3: Using the empirical rule, a z-score of 1 means the score is one standard deviation above the mean, at the 84th percentile (50% below the mean + 34% for half of the 68% within ±1σ).
Result: The student’s score of 90 is in the 84th percentile, meaning they outperformed 84% of the class.
This standard deviation and percentile calculation helps teachers rank students or set grading curves. To visualize this, use our distribution visualizer .
Why Use Empirical Rule for Percentile?
Using an empirical rule percentile calculator offers several advantages:
-
Speed: Quickly estimate percentiles without complex math.
-
Simplicity: Ideal for beginners, requiring only mean, standard deviation, and a data value.
-
Practicality: Applies to real-world data like grades, heights, or financial metrics that follow a normal distribution.
-
Insightful: Shows where a value ranks, helping with decisions like grading or performance analysis.
For example, businesses might use it to rank employee performance, while researchers can assess biological measurements. To explore practical applications, check percentile applications.
FAQs
It’s a tool that estimates the percentile of a data value in a normal distribution using the 68-95-99.7 rule, based on mean and standard deviation.
The rule shows that 68%, 95%, and 99.7% of data fall within one, two, and three standard deviations, helping estimate percentile from standard deviation.
You need the mean, standard deviation, and a specific data value to calculate the 68-95-99.7 rule percentile.
No, the empirical rule percentile calculator is designed for normal distributions. Non-normal data requires other methods.
A z-score measures how far a value is from the mean in standard deviations, while a percentile shows the percentage of data below that value. Use a z-score to percentile calculator for conversions.
It helps rank data points, like student scores or employee performance, in a normal distribution for better decision-making.
Conclusion
The empirical rule percentile calculator is a powerful tool to estimate percentile normal distribution data, making it easy to rank values like test scores or measurements. By leveraging the 68-95-99.7 rule, it simplifies calculating standard deviation and percentile positions in a normal distribution. Whether you’re a student, teacher, or analyst, this tool offers quick, clear insights. Start with our main statistics calculator to try it out, and enhance your analysis with tools like the z-score tool , rank calculator , distribution visualizer , or explore percentile applications for deeper understanding.
Empirical Rule Graph Generator
Visualize the 68-95-99.7 Rule with a bell curve showing standard deviation intervals. Great for quick insights and presentations.
Try CalculatorBell Curve Generator
Create customizable bell curve plots for any normal distribution. Perfect for data analysis and visual reports.
Standard Deviation Shading Calculator
Shade areas under the curve based on standard deviation. Instantly see data coverage between values.
Try CalculatorZ-Score to Graph Plotter
Plot Z-scores on a bell curve and see where your value lies. Understand percentiles and probabilities at a glance.
Try Calculator