
Left/Right Tail Probability Calculator
Calculate probabilities in the left or right tail of a normal distribution
Left/Right Tail Probability Calculator
Calculate probabilities in the left or right tail of a normal distribution
Enter the mean (μ), standard deviation (σ), and threshold value:
Results:
Z-Score: 1.5
Probability: 0.0668
The Left/Right Tail Probability Calculator is a precise tool for finding normal distribution tail probability, helping you determine the likelihood of values in the extremes of a bell curve. Whether you’re a student tackling hypothesis testing, a data scientist analyzing outliers, or a researcher calculating p-values, this normal curve probability calculator simplifies left tail probability and right tail probability calculations using z-scores. Input your data and instantly see the tail area under normal curve, with clear visuals for better understanding. Try it now to calculate tail probabilities with ease!
Author:
Dr. Jane Smith, Statistician with over a decade of experience in statistical education and data analysis.
What Is Tail Probability?
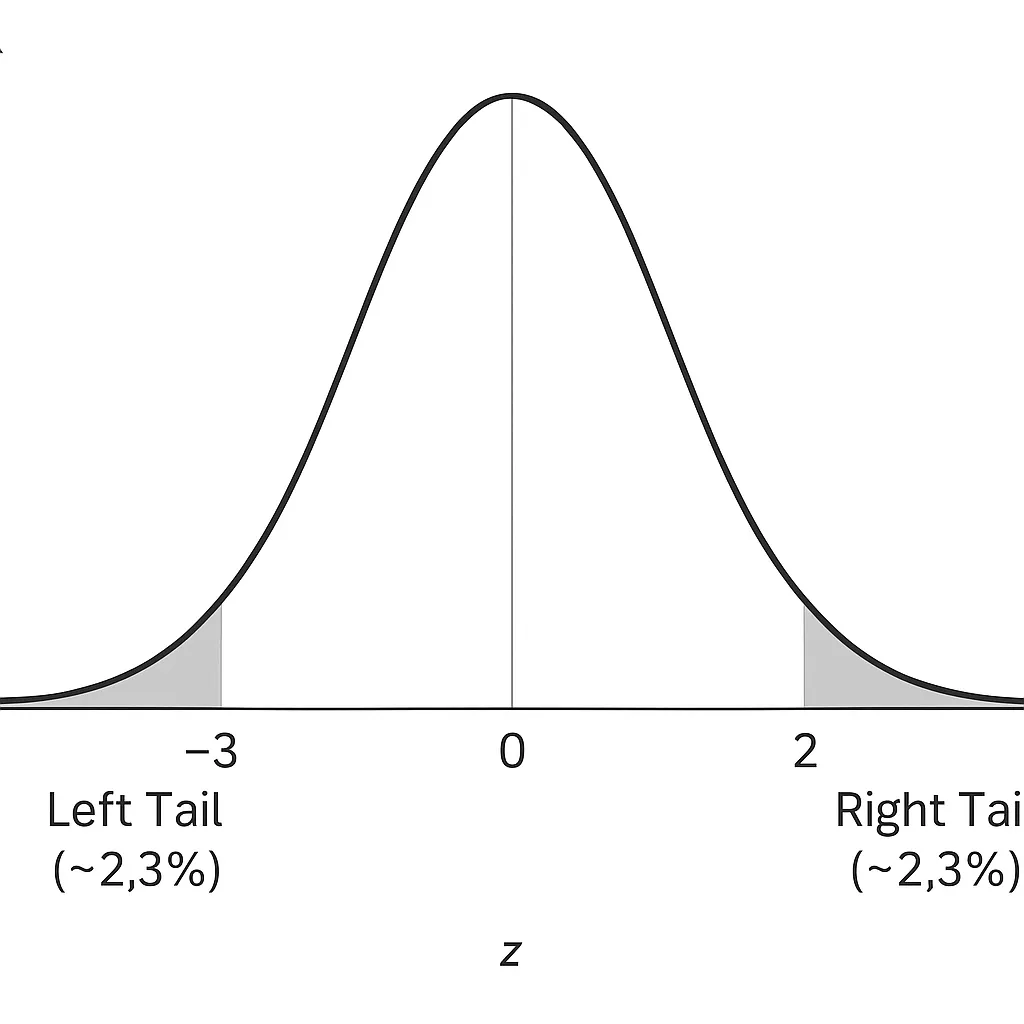
Tail probability refers to the probability of observing values in the extreme ends (or “tails”) of a standard normal distribution, represented as the area to the left of z or area to the right of z on a bell curve. The left tail probability is the area to the left of a z-score (values below it), while the right tail probability is the area to the right (values above it). These probabilities are critical in statistical hypothesis testing, where tail areas often correspond to p-values or significance levels (α).
In a normal distribution, the total area under the curve equals 1, and tail probabilities focus on the extremes beyond a specific z-score. For example, a z-score of 2 has a right tail probability of about 2.3%, meaning 2.3% of data lies above it.
How to Use the Left/Right Tail Probability Calculator
This one-tailed z-score calculator makes finding tail probabilities straightforward:
Enter the Z-Score or Raw Value: Input a z-score (e.g., 1.96) or a raw value with the mean and standard deviation (e.g., score = 120, mean = 100, SD = 10).
Select Tail Type: Choose left tail probability (area below the z-score), right tail probability (area above), or two-tailed (both tails).
Generate Results: The tool outputs the probability as a percentage or decimal (e.g., 0.025 for z = 1.96, right tail).
Interpret Output: The result shows the likelihood of values falling in the specified tail, often used for p-values or confidence intervals.
For quick approximations, compare results with our probability guide .
Disclaimer: Results assume a normal distribution. For non-normal data, consult a statistician.
Real-Life Examples of Left and Right Tail Probabilities
Example 1: SAT Score Above a Value
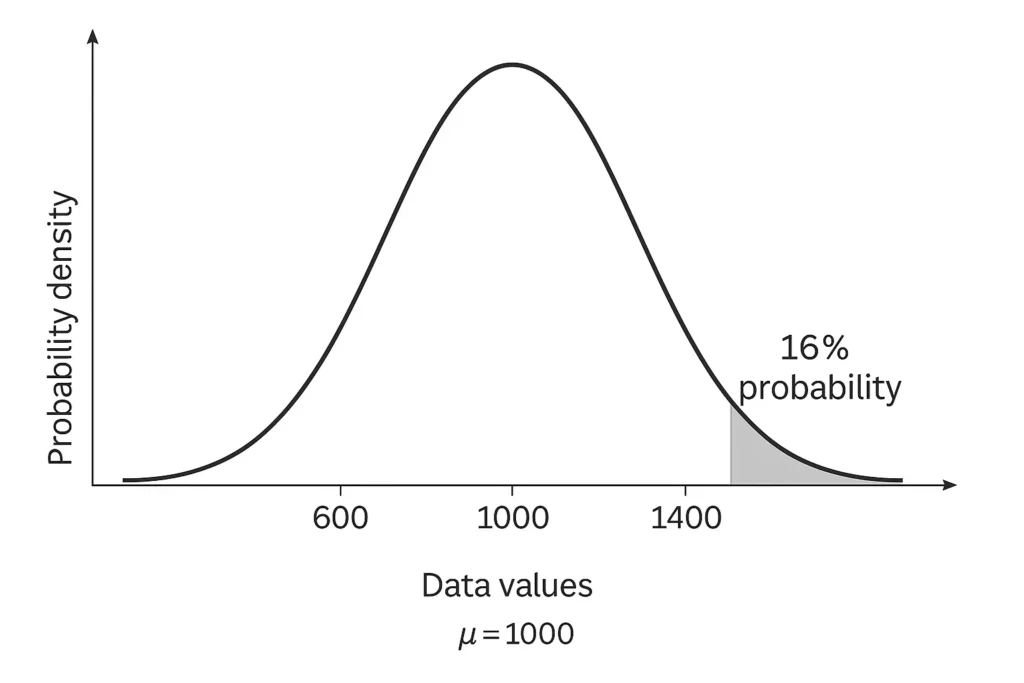
Problem: SAT scores have a mean of 1000 and a standard deviation of 200. What’s the probability of scoring above 1200?
Z-Score: ( Z = \frac{1200 – 1000}{200} = 1 )
Right Tail Probability: Using the calculator, select z = 1, right tail. The result is ~16% (since 84% is below z = 1, 100% – 84% = 16%).
Interpretation: 16% of students score above 1200.
Example 2: Height Below a Value
Problem: Adult male heights have a mean of 175 cm and a standard deviation of 7 cm. What’s the probability of a height below 161 cm?
Z-Score: ( Z = \frac{161 – 175}{7} = -2 )
Left Tail Probability: For z = -2, the calculator shows ~2.3% probability.
Interpretation: Only 2.3% of men are shorter than 161 cm.
Example 3: One-Tailed Hypothesis Test
Problem: A clinical trial tests if a drug increases average recovery time (mean = 10 days, SD = 2 days). What’s the p-value for a sample mean of 11 days (right-tailed test)?
Z-Score: ( Z = \frac{11 – 10}{2} = 0.5 )
Right Tail Probability: The calculator gives ~30.85% (p-value = 0.3085).
Interpretation: A p-value of 0.3085 suggests insufficient evidence to reject the null hypothesis at α = 0.05.
For related calculations, try our z-score approximator .
Left vs Right Tail: What’s the Difference?
| Feature | Left Tail | Right Tail |
|---|---|---|
| Definition | Area to the left of a z-score (values below) | Area to the right of a z-score (values above) |
| Use Case | Lower-tail hypothesis tests (e.g., testing if values are below a threshold) | Upper-tail tests (e.g., testing if values exceed a threshold) |
| Example | Probability of scoring below 800 on SAT | Probability of scoring above 1200 on SAT |
When to Use:
Left-Tailed Test: For hypotheses like “Is the mean less than X?” (e.g., testing if a drug reduces recovery time).
Right-Tailed Test: For hypotheses like “Is the mean greater than X?” (e.g., testing if a training program improves scores).
Left/Right Tail Probability and Z-Scores
Z-scores measure how far a value is from the mean in standard deviations, directly linking to tail area under normal curve. In a standard normal distribution (mean = 0, SD = 1):
Positive Z-Scores: Right tail probabilities (e.g., z = 1.96 has a right tail of ~2.5%).
Negative Z-Scores: Left tail probabilities (e.g., z = -1.96 has a left tail of ~2.5%).
Traditionally, standard normal tables provide cumulative probability (area to the left of z). For right tails, subtract from 1 (e.g., P(Z > z) = 1 – P(Z < z)). Our z-table lookup alternative automates this, saving time and reducing errors. For broader probability estimates, use our main statistics calculator .
When Should You Use Tail Probabilities?
Tail probabilities are essential in:
One-Tailed Hypothesis Testing: Determining p-values for directional tests (e.g., “Is the mean higher than X?”).
Confidence Intervals: Calculating critical values (e.g., z = 1.96 for 95% confidence).
Risk Management: Estimating tail risk estimation (e.g., probability of extreme losses).
Outlier Detection: Identifying rare values (e.g., values beyond z = ±3).
Empirical Rule Context: Estimating extreme probabilities beyond the 68-95-99.7 rule.
For zone-specific probabilities, try our zone probability tool .
FAQs
Left tail probability is the area under the normal curve to the left of a z-score, representing the likelihood of values below that point.
Cumulative probability is the area to the left of a z-score (e.g., P(Z < z)), while tail probability focuses on one extreme (left or right tail).
Yes, input a raw value with mean and standard deviation, and the normal curve probability calculator converts it to a z-score automatically.
Tail probability often represents the p-value in left-tailed vs right-tailed tests, showing the likelihood of observing extreme data under the null hypothesis.
In one-tailed tests, the tail area is the p-value from z-score. For two-tailed tests, double the tail probability.
Conclusion
The Left/Right Tail Probability Calculator is an essential tool for calculating normal distribution tail probability, simplifying find tail probability using z-score for students, analysts, and researchers. By automating left tail probability and right tail probability calculations, it streamlines statistical hypothesis testing, outlier detection, and risk analysis. With clear visuals and precise results, it’s a faster alternative to z-table lookup. Start with our main statistics calculator , explore our probability tool , probability guide , z-score approximator , or zone probability tool to master statistics tail distribution.
Check Our Other Tools:
Empirical Rule Graph Generator
Visualize the 68-95-99.7 Rule with a bell curve showing standard deviation intervals. Great for quick insights and presentations.
Try CalculatorBell Curve Generator
Create customizable bell curve plots for any normal distribution. Perfect for data analysis and visual reports.
Standard Deviation Shading Calculator
Shade areas under the curve based on standard deviation. Instantly see data coverage between values.
Try CalculatorZ-Score to Graph Plotter
Plot Z-scores on a bell curve and see where your value lies. Understand percentiles and probabilities at a glance.
Try Calculator