
Empirical Rule Zones Probability Tool
Calculate probabilities for specific zones defined by standard deviations
Empirical Rule Zones Probability Tool
Calculate probabilities for specific zones defined by standard deviations
Enter the mean (μ) and standard deviation (σ) of your normal distribution:
Probability Results by Zone:
| Zone | Range | Probability |
|---|
The Empirical Rule Zones Probability Tool helps students, educators, and data analysts calculate and visualize probability within standard deviations in a normal distribution using the 68-95-99.7 rule. By entering mean, standard deviation, and desired zones (1σ, 2σ, or 3σ), this empirical rule zone calculator instantly shows the area under the curve for normal distribution with clear, shaded visuals. Perfect for AP Stats, test prep, or quality control, it simplifies normal curve zone probability for quick, accurate insights. Try it now to explore probability zones!
Author:
Dr. Jane Smith, Statistician with 12 years of experience in statistical education and data analysis, dedicated to clear statistical tools.
What Are Empirical Rule Zones?
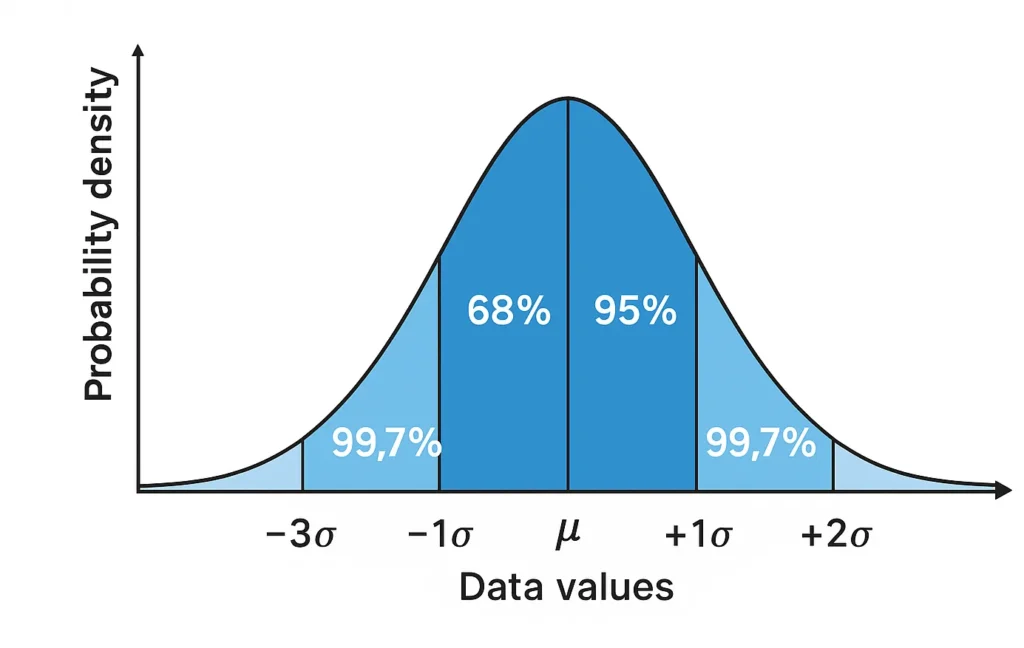
The Empirical Rule, or 68-95-99.7 rule, describes how data spreads in a normal distribution, a bell-shaped curve centered at the mean (μ). It divides data into zones based on standard deviations (σ):
1σ Zone: 68% of data lies within ±1 standard deviation from the mean.
2σ Zone: 95% lies within ±2 standard deviations.
3σ Zone: 99.7% lies within ±3 standard deviations.
These zones represent the probability between two z-scores in a symmetrical distribution, making them ideal for estimating probabilities in datasets like test scores or product measurements. The three sigma rule interpretation is widely used in statistics for its simplicity.
How This Tool Works
The empirical rule distribution zones tool is user-friendly and provides instant results:
Input Mean (μ): Enter the dataset’s average (e.g., 100 for test scores).
Input Standard Deviation (σ): Specify the data spread (e.g., 15).
Select Zone or Custom Range: Choose 1σ, 2σ, or 3σ, or enter custom z-scores (e.g., -1 to 1).
View Output: The tool calculates the area under the curve (e.g., 68% for ±1σ) and displays a shaded bell curve highlighting the selected zone.
Output: Probability as a percentage (e.g., 95%) and a visual graph showing the zone. For broader probability calculations, try our probability tool .
Example Calculations Using the Empirical Rule
Here are empirical rule application examples:
1σ Zone: For a dataset with mean = 50, SD = 5, the probability between 45 and 55 (z = -1 to z = 1) is 68%.
2σ Zone: For the same dataset, the probability between 40 and 60 (z = -2 to z = 2) is 95%.
3σ Zone: The probability between 35 and 65 (z = -3 to z = 3) is 99.7%.
Use Case: In a class with test scores (mean = 75, SD = 10), the tool shows 68% of students score between 65 and 85 (±1σ). For custom ranges, use our tail probability tool .
Applications in the Real World
The Empirical Rule Zones Probability Tool is used in:
Educational Assessments: Estimate the percentage of students scoring within a range (e.g., 68% within ±1σ of the mean SAT score).
Medical Diagnostics: Assess health metrics like blood pressure, where 95% of patients fall within ±2σ of the average.
Business Risk Analysis: Predict the likelihood of financial outcomes within standard deviation zones.
Quality Control: Monitor defect rates, ensuring 99.7% of products meet specs within ±3σ.
These empirical rule application examples make data analysis intuitive. For more on probability calculations, see our probability guide .
Empirical Rule vs Actual Z-Table Calculation
The Empirical Rule provides quick approximations for probability within standard deviations, while z-tables offer exact probabilities:
Empirical Rule: Estimates probabilities for ±1σ (68%), ±2σ (95%), and ±3σ (99.7%). Ideal for quick insights.
Z-Table: Gives precise probabilities for any z-score but requires lookup or software.
Why Use This Tool: Faster than z-tables, with visual outputs for normal distribution probability zones. Best for normally distributed data with large samples.
For precise z-score conversions, try our z-score tool .
FAQs
The Empirical Rule divides a normal distribution into three zones: ±1σ (68%), ±2σ (95%), and ±3σ (99.7%) around the mean.
Use the 68-95-99.7 rule calculator: input mean and standard deviation, select a zone (e.g., ±1σ), and get the probability (e.g., 68%).
It’s accurate for normally distributed data with large samples but is an approximation. For exact values, use a z-table.
It calculates and visualizes normal curve zone probability, making it easy to estimate probabilities within standard deviation ranges.
Conclusion
The Empirical Rule Zones Probability Tool simplifies calculating probability within standard deviations using the 68-95-99.7 rule, offering clear visuals and fast results for students, analysts, and educators. Whether analyzing test scores or quality control metrics, this empirical rule graph tool makes area under the curve for normal distribution intuitive. Start with our main statistics calculator , or explore tools like the probability tool , probability guide , tail probability tool , or z-score tool to master statistical analysis.
Check Our Other Tools:
Empirical Rule Percentile Calculator
Quickly estimate percentiles in a normal distribution using the 68-95-99.7 rule. Input mean, standard deviation, and a score to find its percentile rank.
Try CalculatorZ-Score to Percentile Converter
Convert a z-score to a percentile in a normal distribution. Enter your z-score to see the percentage of data below it, ideal for test scores or analytics.
Try CalculatorPercentile Rank Calculator
Find your score’s percentile rank without needing mean or standard deviation. Input your score and rank to see where you stand in any dataset.
Try CalculatorNormal Distribution to Percentile Visualizer
Visualize your score on a bell curve with shaded percentile areas. Enter mean, standard deviation, and a score to see its rank in a normal distribution.
Try Calculator