
Empirical Rule vs. Confidence Intervals: What’s the Difference?
The empirical rule vs confidence interval debate often confuses students and analysts, but the distinction is clear: the Empirical Rule (68–95–99.7 rule) describes how data spreads in a known population, while confidence intervals estimate where a population parameter likely lies based on a sample. Both rely on normal distribution assumptions and standard deviation, but they serve different purposes in descriptive vs inferential statistics. This guide breaks down the difference between empirical rule and confidence interval, with examples, visuals, and practical applications. Ready to clarify? Try our interval calculator .
Author:
Dr. Sarah Ahmed, Ph.D. in Statistics, 15+ years teaching and consulting in data science.
Understanding the Empirical Rule (68–95–99.7 Rule)
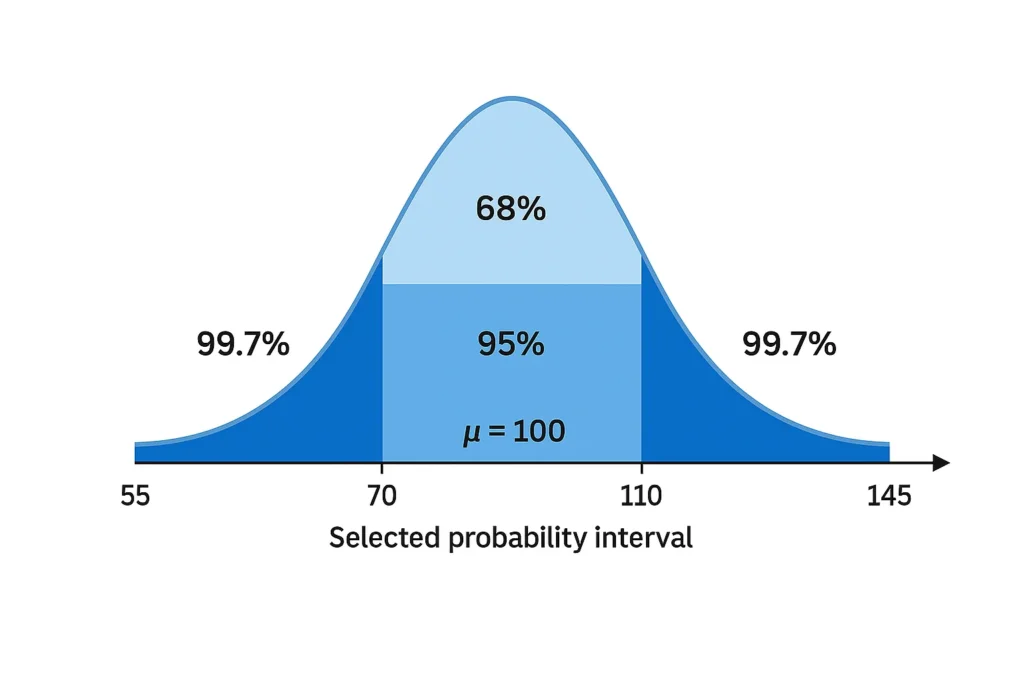
The Empirical Rule, also called the 68-95-99.7 rule, is a descriptive statistic that applies to normally distributed data. It states:
68% of values fall within 1 standard deviation (±1σ) of the mean.
95% within 2 standard deviations (±2σ).
99.7% within 3 standard deviations (±3σ).
This rule helps visualize data spread in a bell curve and is ideal for summarizing population data like IQ scores or heights.
Example: IQ scores have a mean of 100 and standard deviation of 15.
68% of people score between 85 and 115.
95% between 70 and 130.
99.7% between 55 and 145.
Understanding Confidence Intervals (90–95–99%)
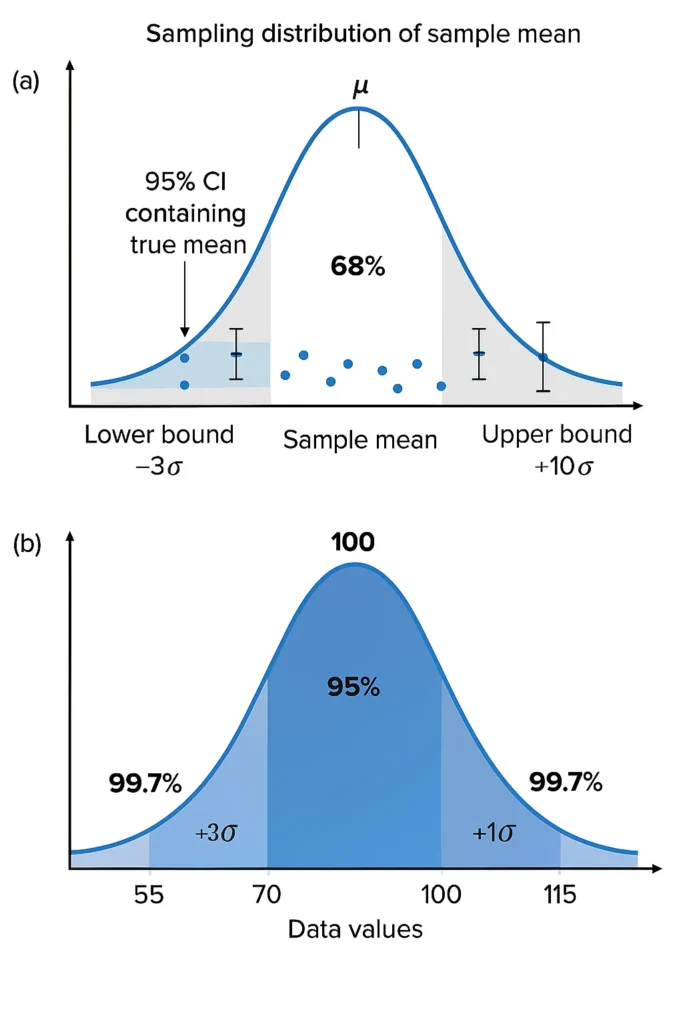
A confidence interval (CI) is an inferential statistic that estimates a range where the true population mean likely lies, based on a sample. It uses the sample mean (X̄), standard deviation, sample size (n), and a confidence level (e.g., 95%).
Formula:
[ \text{CI} = \bar{X} \pm Z_{\alpha/2} \left( \frac{\sigma}{\sqrt{n}} \right) ]
Where:
( Z_{\alpha/2} ) = critical z-score (e.g., 1.96 for 95%)
( \sigma ) = population standard deviation (or sample SD for large n)
Example: A survey of 100 students finds an average test score of 82 with a sample SD of 10. A 95% CI is:
[ 82 \pm 1.96 \left( \frac{10}{\sqrt{100}} \right) = 82 \pm 1.96 = [80.04, 83.96] ]
We are 95% confident the true population mean is between 80.04 and 83.96.
| Feature | Empirical Rule | Confidence Interval |
|---|---|---|
| Purpose | Describes population data spread | Estimates population mean from a sample |
| Based On | Mean and standard deviation of full dataset | Sample mean, SD, and sample size |
| Type | Descriptive | Inferential |
| Typical % | 68%, 95%, 99.7% | 90%, 95%, 99% |
| Use Case | Summarize known data | Make predictions from sample |
The empirical rule explained as a descriptive tool vs. confidence interval explained as inferential is key to avoiding misuse.
Relationship Between the Two Concepts
Both rely on:
Normal distribution assumptions
Standard deviation as a measure of variability
Z-scores for critical values (e.g., z = 1.96 ≈ 95%)
The Empirical Rule can be seen as a simplified model of data spread in a population, while confidence intervals use similar logic but account for sampling error (( \frac{\sigma}{\sqrt{n}} )).
Analogy: The Empirical Rule is like measuring the width of a river with a tape measure. A confidence interval is like estimating the river’s width from a few boat crossings.
When to Use Each
Use the Empirical Rule when:
You have complete population data (or assume normality).
You want to describe variability (e.g., “95% of products weigh between X and Y”).
You’re teaching or visualizing data spread.
Use Confidence Intervals when:
You have a sample and want to infer about the population.
You’re conducting hypothesis testing or reporting survey results.
You need to quantify uncertainty in estimates.
For sample-based intervals, try our confidence calculator .
| Type | Coverage | Typical Values | Purpose |
|---|---|---|---|
| Empirical Rule | Fixed σ intervals | 68%, 95%, 99.7% | Describes population data spread |
| Confidence Interval | Dynamic, based on sampling | 90%, 95%, 99% | Estimates population mean |
Common Misconceptions
Myth: “A 95% confidence interval means 95% of data falls in this range.”
Fact: It means 95% of such intervals would contain the true mean if repeated.Myth: “The Empirical Rule gives a confidence interval.”
Fact: It describes data distribution, not parameter estimation.Myth: “You can always use 95% for both.”
Fact: 95% in the Empirical Rule is exact for ±2σ; in CIs, it’s approximate and depends on sample size.
Learn more with our interval guide .
Related Tools to Explore
Empirical Rule Confidence Interval Calculator: Estimate data ranges using 1σ, 2σ, or 3σ .
Confidence Interval from Mean and Standard Deviation Calculator: Build sample-based CIs .
Margin of Error Using Empirical Rule Calculator: Estimate error in population descriptions .
Empirical Rule Confidence Zone Visualizer: See intervals on a bell curve.
FAQs
The Empirical Rule describes how data is distributed in a population (e.g., 95% within ±2σ). A confidence interval estimates where the true population mean lies based on a sample.
Not directly. The Empirical Rule is descriptive; confidence intervals are inferential and require sample size and sampling distribution.
Yes. The Empirical Rule uses population SD (σ) to describe spread. Confidence intervals use sample SD and adjust for sample size (( \frac{\sigma}{\sqrt{n}} )).
There’s no direct match. The 95% in the Empirical Rule is exact for ±2σ in a population. A 95% confidence interval is approximate and depends on sampling.
Rarely. It’s descriptive. Confidence intervals and p-values are standard in hypothesis testing.
Conclusion
Understanding empirical rule vs confidence interval is essential for correct statistical interpretation. The Empirical Rule helps describe data spread in a known population using the 68-95-99.7 rule, while confidence intervals help infer population parameters from samples using margin of error and confidence levels. Use the Empirical Rule for data summarization; use confidence intervals for statistical inference. Want to apply both? Try our Empirical Rule Confidence Interval Calculator or explore sample-based analysis with the Confidence Interval from Mean and Standard Deviation Calculator, Margin of Error Using Empirical Rule Calculator, and Empirical Rule Confidence Zone Visualizer. Check our Main Calculator.
Z-Score to Percentile Converter
Convert a z-score to a percentile in a normal distribution. Enter your z-score to see the percentage of data below it, ideal for test scores or analytics.
Try CalculatorEmpirical Rule Probability Finder
Calculate probabilities under a normal distribution using the 68-95-99.7 rule with easy inputs and visual bell curve outputs.
Try CalculatorLeft/Right Tail Probability Calculator
Find left or right tail probabilities in a normal distribution using z-scores, perfect for hypothesis testing and p-values.
Try CalculatorProbability to Z-Score Approximation Tool
Convert cumulative probabilities to z-scores in a normal distribution, ideal for test scores and data analysis.
Try Calculator