
Outlier Threshold Calculator (Mean ± k*SD Tool)
Common values: 1.5, 2, 2.5, 3
Threshold Results
Interpretation
Common Applications
The outlier threshold calculator is a versatile tool that helps you determine custom cutoffs for identifying potential outliers in your data. Using the formula Upper Limit = Mean + k·SD and Lower Limit = Mean – k·SD, it allows you to set flexible boundaries based on your chosen k-value—the number of standard deviations from the mean. This customization makes it perfect for various scenarios, from statistical analysis to quality control.
Analysts often prefer this method because it adapts to different levels of sensitivity. For example, a lower k detects more anomalies in noisy data, while a higher k focuses on extreme cases. If you’re sticking to standard values like k=2 or k=3, our Empirical Rule Calculator can provide quick insights into the classic 68-95-99.7 rule.
What Is an Outlier Threshold?
An outlier threshold is a numerical boundary that flags data points as unusual if they fall outside it. In statistics, these thresholds are often based on the mean (average) and standard deviation (a measure of data spread). The mean represents the center of your dataset, while standard deviation shows how much values typically vary from that center.
This approach works best for normally distributed data, where most points cluster around the mean. For instance, any value beyond Mean ± 3·SD is often flagged as an extreme outlier because it deviates significantly from the norm. The outlier threshold calculator lets you define these cutoffs dynamically, making it a key tool in anomaly detection using SD.
How the Outlier Threshold Calculator Works
The outlier threshold calculator simplifies the process of setting boundaries for outlier detection. It uses your inputs to compute upper and lower limits instantly. Here’s how it operates step by step:
- Enter the Mean (μ): Provide the average value of your dataset.
- Enter the Standard Deviation (σ): Input the measure of variation in your data.
- Choose the k-Value: Select how many standard deviations you want as your threshold (e.g., 2 for mild, 3 for extreme).
- Calculate the Thresholds: The tool generates:
- Upper Threshold = μ + k·σ
- Lower Threshold = μ – k·σ
- Interpret Results: Any data point above the upper or below the lower threshold is a potential outlier.
For a quick example, suppose you’re analyzing exam scores with a mean of 70 and a standard deviation of 8. If you set k=2.5:
- Upper Threshold = 70 + (2.5 × 8) = 90
- Lower Threshold = 70 – (2.5 × 8) = 50
Values below 50 or above 90 would be flagged. This sigma threshold calculator makes it easy to adjust for your needs.
Why Use Custom k Values? (Flexible Outlier Detection)
Custom k-values give the outlier threshold calculator its power, allowing for flexible outlier criteria tailored to your data and goals. Unlike fixed rules, you can fine-tune sensitivity:
- k=1.5: Highly sensitive, ideal for detecting subtle anomalies in manufacturing or quality control where even small deviations matter.
- k=2: Balances detection, often used for mild outlier checks in financial data or sensor readings.
- k=2.5: A middle ground for datasets with moderate variability, like customer satisfaction scores.
- k=3: Aligns with the empirical rule for extreme outlier detection, common in research or medical testing.
- k=4 or more: For high-noise environments, like stock market volatility, where only major extremes are flagged.
Analysts choose different k-values based on industry needs, data variability, required sensitivity, and measurement accuracy. For instance, in a high-precision lab, a lower k might catch errors early, while in noisy field data, a higher k avoids false alarms. This dynamic sigma rule calculator empowers you to adapt the k sigma outlier rule to real-world situations.
Outlier Threshold Example (Step-by-Step)
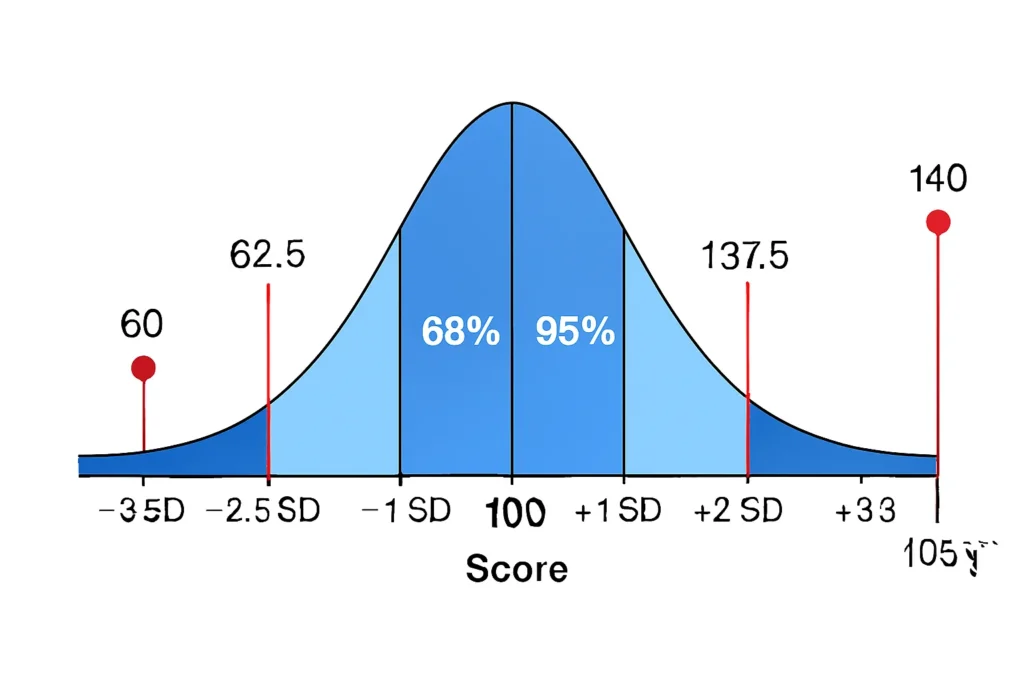
Let’s walk through a detailed example using the outlier threshold calculator for a practical scenario: analyzing IQ scores in a group study.
- Step 1: Gather Data Basics – Mean (μ) = 100 (average IQ), Standard Deviation (σ) = 15 (typical spread).
- Step 2: Choose k – Set k=2.5 for a balanced check, more sensitive than the standard k=3 but less than k=2.
- Step 3: Calculate Thresholds:
- Upper Threshold = 100 + (2.5 × 15) = 100 + 37.5 = 137.5
- Lower Threshold = 100 – (2.5 × 15) = 100 – 37.5 = 62.5
- Step 4: Interpret – An IQ of 140 exceeds 137.5, so it’s a potential upper outlier (unusually high). An IQ of 60 falls below 62.5, marking it as a lower outlier (unusually low).
In this case, these thresholds help researchers spot participants who might need further review. The mean ± k standard deviation method provides clear upper and lower outlier limits.
Empirical Rule vs Custom k·SD Thresholds
The empirical rule offers a fixed framework for outlier detection, but custom k·SD thresholds provide more flexibility. Here’s a comparison:
| Feature | Empirical Rule | Custom k·SD Thresholds | Fixed Values |
|---|---|---|---|
| Fixed Values | ±1σ (68%), ±2σ (95%), ±3σ (99.7%) | User chooses any k (e.g., 1.5, 2.5) | — |
| Best For | Teaching & normal data | Analysts, QC, anomaly detection | — |
| Flexibility | Low | Very high | — |
| Precision Options | None | Adjust sensitivity | — |
The empirical rule is great for beginners, but custom thresholds shine in varied applications. For strict empirical-rule classification, use the Empirical Rule Outlier Detector. If you need help identifying outliers step-by-step, see How to Identify Outliers Using the Empirical Rule (68–95–99.7%).
This z-score outlier threshold approach (since Z = (X – μ)/σ relates directly to k) allows for a custom outlier detection tool that’s adaptable.
When NOT to Use Mean ± k·SD Thresholds
While powerful, the mean ± k standard deviation method has limitations and isn’t suitable for every dataset. Avoid it when:
- Data is Skewed: If your distribution isn’t symmetric (e.g., income data with a long right tail), thresholds may flag too many false positives on one side.
- Small Sample Sizes: With fewer than 30 observations, standard deviation estimates are unreliable, leading to inaccurate boundaries.
- Mean Affected by Extremes: Outliers in your data can inflate the mean and SD, distorting thresholds—consider robust alternatives like median-based methods.
- Non-Normal Distributions: Heavy-tailed or bimodal data doesn’t follow the expected spread, making k-values misleading.
To ensure reliability, combine this with a normality check. Our Normality Check Before Outlier Detection Tool can help verify if your data is close to normal before applying these thresholds. In such cases, methods like IQR might be better for anomaly detection using SD alternatives.
FAQs
It’s a customizable cutoff using Mean ± k·SD, where k determines how many standard deviations from the mean qualify as an outlier.
Select based on your needs: lower k (e.g., 1.5) for sensitivity in clean data, higher k (e.g., 3+) for focusing on extremes in noisy environments.
No, it aligns with the empirical rule for normal data, but adjust k for different sensitivities—use 2 for milder checks or 4 for high tolerance.
Yes, by setting a high k (e.g., 4 or 5), it flags only the most extreme values in your dataset.
Not reliably—skewed distributions distort thresholds. Always verify normality first.
Related Tools
If you want automatic outlier classification, try the Empirical Rule Outlier Detector. Before choosing a k-value, it’s smart to assess distribution shape using our Normality Check Before Outlier Detection Tool. For focused extreme checks, explore the Empirical Rule Extreme Value Finder. Dive into basics with the Empirical Rule Calculator or learn more from How to Identify Outliers Using the Empirical Rule (68–95–99.7%).
Conclusion
The outlier threshold calculator offers a flexible, powerful way to set custom outlier thresholds using Mean ± k·SD, making it essential for analysts, students, and professionals in quality control or statistical monitoring. By adjusting k, you can tailor sensitivity to your data’s variability, whether detecting subtle anomalies or extreme deviations. It works best for datasets that are close to normal, providing dynamic boundaries for upper and lower outlier limits.
Z-Score to Percentile Converter
Convert a z-score to a percentile in a normal distribution. Enter your z-score to see the percentage of data below it, ideal for test scores or analytics.
Try CalculatorEmpirical Rule Probability Finder
Calculate probabilities under a normal distribution using the 68-95-99.7 rule with easy inputs and visual bell curve outputs.
Try CalculatorLeft/Right Tail Probability Calculator
Find left or right tail probabilities in a normal distribution using z-scores, perfect for hypothesis testing and p-values.
Try CalculatorProbability to Z-Score Approximation Tool
Convert cumulative probabilities to z-scores in a normal distribution, ideal for test scores and data analysis.
Try Calculator