
Confidence Interval from Mean and Standard Deviation Calculator
Results
95%
-
-
-
-
-
-
Interpretation
Enter values and click calculate to see the interpretation.
Formula Used
CI = x̄ ± t* × (s / √n)
Where:
- x̄ = sample mean
- t* = critical value from t-distribution
- s = sample standard deviation
- n = sample size
- SE = s / √n (standard error)
The confidence interval from mean and standard deviation calculator enables researchers, analysts, and students to compute exact confidence intervals using sample statistics. Input your sample mean (X̄), standard deviation (s), and sample size (n) to generate precise 90%, 95%, or 99% confidence ranges — ideal for inferential statistics and statistical inference. Unlike descriptive tools, this calculator uses Z or T critical values to estimate where the true population mean likely lies. Compare this exact confidence range to our Empirical Rule Confidence Interval Calculator for estimated coverage.
Author:
Prof. Aisha Khan, Ph.D. in Statistics, 18+ years in research methodology and data science.
What Is a Confidence Interval?
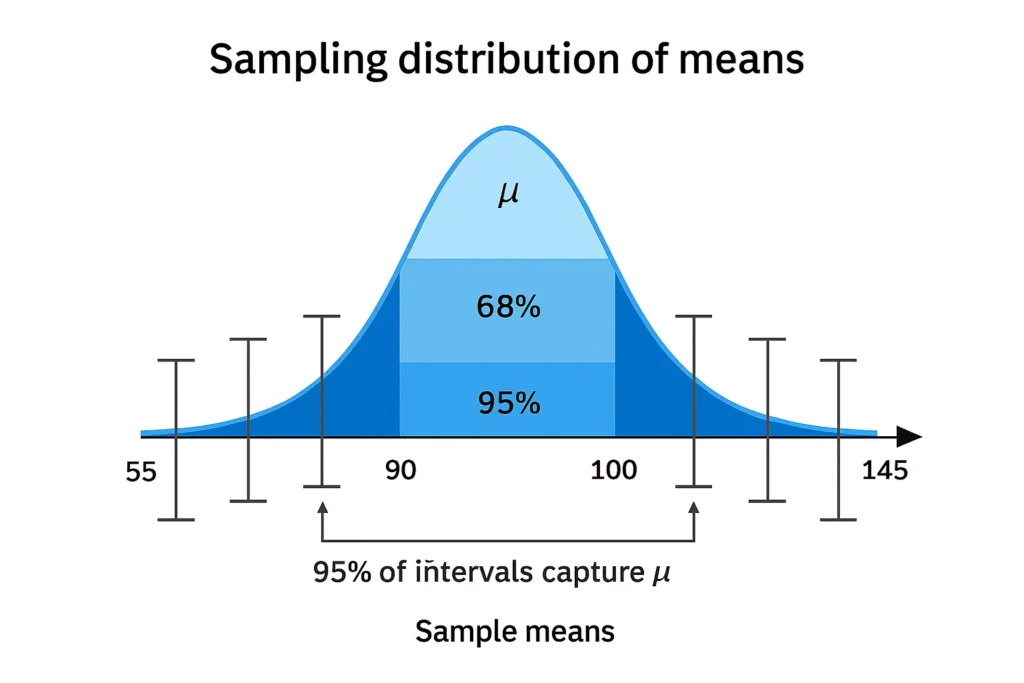
A confidence interval (CI) is a range of values, derived from a sample, that is likely to contain the true population mean with a specified level of confidence (e.g., 95%). It reflects sampling uncertainty and is expressed as:
Sample Mean ± Margin of Error
For example, a 95% CI of [78.5, 81.5] means: If we repeated this sampling process many times, 95% of the resulting intervals would contain the true population mean.
This is inferential, not descriptive — it estimates a population parameter from sample data.
Formula for Confidence Interval Using Mean and Standard Deviation
The calculator uses two formulas based on sample size and distribution assumptions:
Z-Distribution (Large Samples, n ≥ 30)
[ \text{CI} = \bar{X} \pm Z_{\alpha/2} \times \frac{\sigma}{\sqrt{n}} ]
T-Distribution (Small Samples, n < 30)
[ \text{CI} = \bar{X} \pm T_{\alpha/2, df} \times \frac{s}{\sqrt{n}} ] df = n – 1
| Term | Meaning |
|---|---|
| (\bar{X}) | Sample mean |
| (s) or (\sigma) | Sample or population standard deviation |
| (n) | Sample size |
| (Zα/2) | Critical Z-value (e.g., 1.96 for 95%) |
| (Tα/2, df) | Critical T-value (depends on degrees of freedom) |
Rule of Thumb: Use Z when (n \geq 30) or (\sigma) is known. Use T for smaller samples with unknown (\sigma).
How to Use the Confidence Interval Calculator
Follow these steps to calculate confidence interval using mean and standard deviation:
Enter Sample Mean (X̄): e.g., 75
Enter Sample Standard Deviation (s): e.g., 10
Input Sample Size (n): e.g., 25
Select Confidence Level: 90%, 95%, or 99%
Click Calculate: Get lower/upper bounds and margin of error
Note: The tool auto-selects Z or T based on sample size and normality assumptions.
![Screenshot of confidence interval calculator with inputs: mean=75, standard deviation=10, sample size=25, 95% confidence level. Output: CI = [70.9, 79.1], Margin of Error = 4.1.](https://empiricalrulecalculators.com/wp-content/uploads/2025/11/Confidence-Interval-Calculator-Example-95-CI.webp)
Example: Calculate a 95% Confidence Interval
Given:
Sample mean ((\bar{X})) = 75
Sample SD (s) = 10
Sample size (n) = 25
Confidence level = 95%
Step-by-Step:
Standard Error = (\frac{s}{\sqrt{n}} = \frac{10}{\sqrt{25}} = 2)
df = 25 – 1 = 24
T-critical value (95%, df=24) ≈ 2.064
Margin of Error = (2.064 \times 2 = 4.128)
CI = (75 \pm 4.128 = [70.872, 79.128])
Interpretation:
“We are 95% confident that the true population mean lies between 70.9 and 79.1.”
For larger samples (n ≥ 30), the Z-value (1.96) would yield a slightly narrower interval.
Empirical Rule vs Confidence Interval (Connection Section)
| Aspect | Empirical Rule | Confidence Interval |
|---|---|---|
| Purpose | Describes data spread in a population | Estimates population mean from a sample |
| Input | Population mean (μ), SD (σ) | Sample mean (X̄), SD (s), n |
| Output | % of data in range (68%, 95%, 99.7%) | Range likely containing true mean |
| Type | Descriptive | Inferential |
| Assumption | Normal distribution | Normal sampling distribution |
Key Insight:
The Empirical Rule tells you where data falls. A confidence interval tells you where the true mean likely is.
Visual Prompt:
(Insert side-by-side bell curves:
Left: Empirical Rule with ±1σ, ±2σ, ±3σ zones (68–95–99.7%)
Right: Confidence interval around sample mean with error bars)
Compare this exact confidence range to our Empirical Rule Confidence Interval Calculator for estimated coverage.
Common Confidence Levels
| Confidence Level | Z-Value | T-Value (df=20) | Use Case |
|---|---|---|---|
| 90% | 1.645 | ~1.725 | Moderate precision |
| 95% | 1.96 | ~2.086 | Standard in research |
| 99% | 2.576 | ~2.845 | High certainty |
When to Use This Calculator
Use the confidence interval from mean and standard deviation calculator when:
Conducting surveys or experiments with sample data
Reporting statistical precision in research papers
Estimating population parameters in quality control
Performing hypothesis testing with margin of error
It’s essential in statistical modeling, data science, and scientific research.
FAQs
Enter your sample mean, standard deviation, and size into the confidence interval calculator. Select a confidence level (90%, 95%, 99%) to get the range.
Z is used for large samples (n ≥ 30) or known population SD. T is used for small samples with unknown SD, accounting for greater uncertainty.
95% is the standard in most research. Use 90% for less precision, 99% for high-stakes decisions.
No. This is for sample-based inference. For full population data, use the Empirical Rule.
The Empirical Rule describes data spread (68–95–99.7%). This calculator estimates the population mean from a sample using standard error.
Related Tools
Empirical Rule Confidence Interval Calculator: Estimate data coverage in populations
Margin of Error Using Empirical Rule Calculator: Quick error bounds for known populations
Empirical Rule Confidence Zone Visualizer: See intervals on a bell curve
Z-Score to Percentile Calculator: Convert z-scores to percentile Calculator]
Conclusion
The confidence interval from mean and standard deviation calculator is a powerful tool for inferential statistics, enabling precise estimation of population means from sample data. Whether you’re in research, quality assurance, or data analysis, this confidence interval calculator delivers statistically reliable results with clear interpretation. For population-level descriptions, compare your results with our Empirical Rule Confidence Interval Calculator. Check our Main Tool.
Empirical Rule Calculator
Explore our statistical tools: calculate percentiles, visualize bell curves, and plot z-scores with simple, accurate calculators for normal distributions.
Try CalculatorEmpirical Rule Graph Generator
Visualize the 68-95-99.7 Rule with a bell curve showing standard deviation intervals. Great for quick insights and presentations.
Try CalculatorBell Curve Generator
Create customizable bell curve plots for any normal distribution. Perfect for data analysis and visual reports.
Standard Deviation Shading Calculator
Shade areas under the curve based on standard deviation. Instantly see data coverage between values.
Try Calculator