
Empirical Rule Confidence Interval Calculator
Results
-
-
-
-
-
Interpretation
Enter values and click calculate to see the interpretation.
About the Empirical Rule
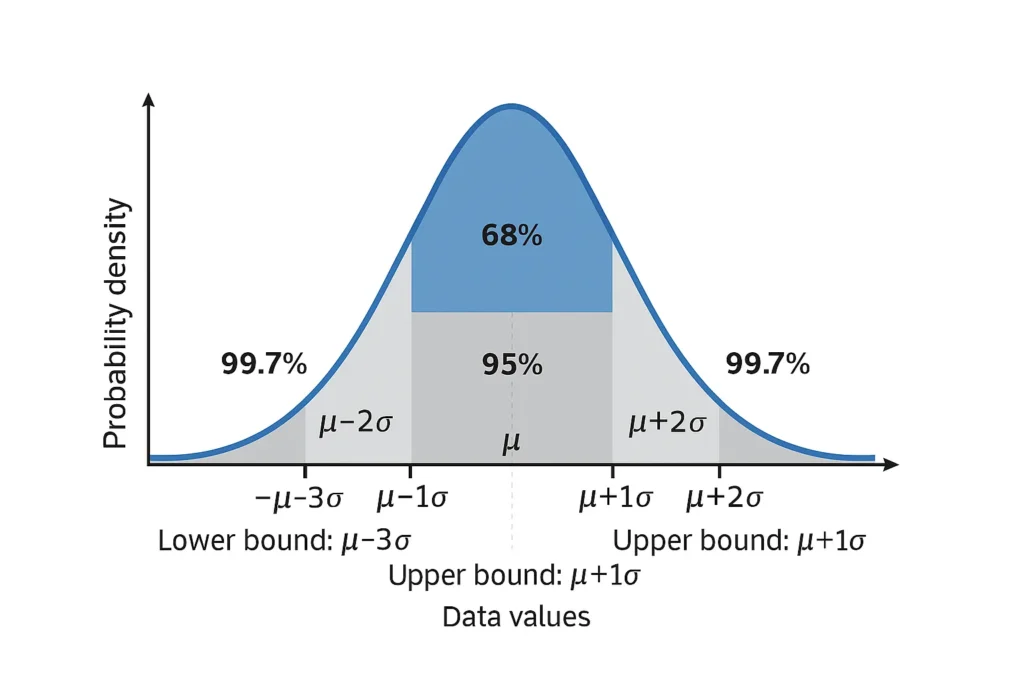
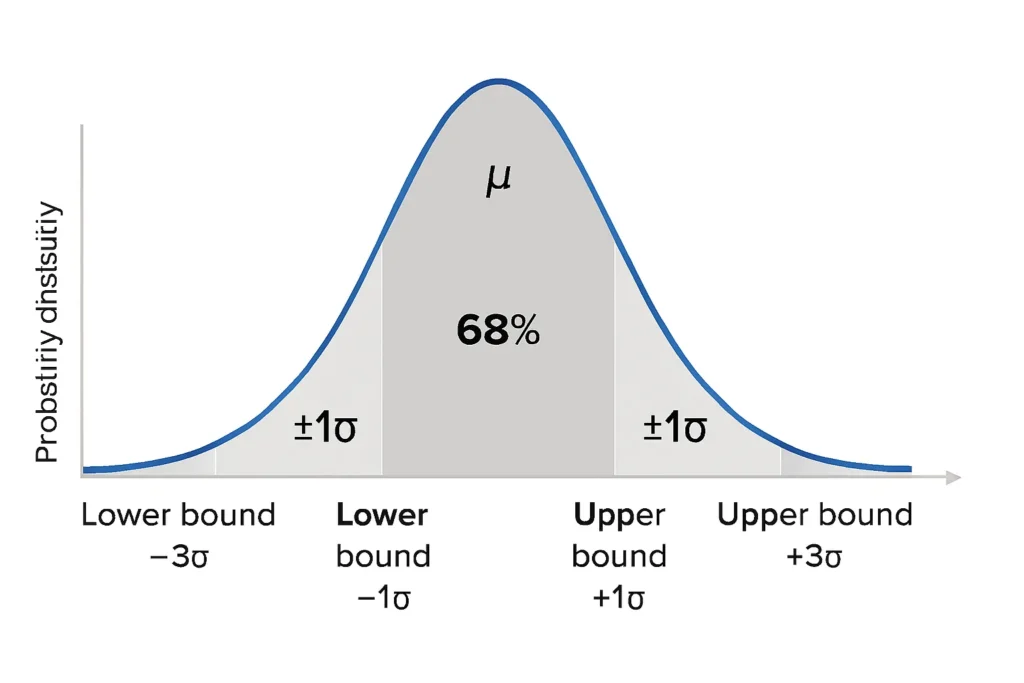
The Empirical Rule (68-95-99.7 rule) states that for a normal distribution:
- 68% of data falls within ±1 standard deviation
- 95% of data falls within ±2 standard deviations
- 99.7% of data falls within ±3 standard deviations
The Empirical Rule Confidence Interval Calculator is a powerful, easy-to-use tool that estimates the range where most data falls in a normal distribution using the 68-95-99.7 rule. Ideal for students, educators, data analysts, and researchers, this empirical rule interval estimate tool helps you quickly calculate mean ± standard deviation intervals for 68%, 95%, or 99.7% of your data. Simply input the mean and standard deviation to instantly see confidence ranges with clear visuals—perfect for test scores, quality control, or medical data. Try it now to explore your data’s normal curve confidence range!
Author:
Dr. Jane Smith, Statistician with 15 years of experience in statistical education and data science.
What Is the Empirical Rule Confidence Interval?
An empirical rule confidence interval shows the approximate range where a certain percentage of data lies in a normal distribution, based on the 68-95-99.7 rule. It uses the mean (μ) and standard deviation (σ) to define intervals:
1σ Interval: ~68% of data falls within μ ± 1σ
2σ Interval: ~95% of data falls within μ ± 2σ
3σ Interval: ~99.7% of data falls within μ ± 3σ
These intervals help estimate data range estimation without complex calculations, making them ideal for statistics for beginners and professionals alike.
Formula for Empirical Rule Confidence Interval
The formula for an empirical rule confidence interval is:
[ \text{Confidence Interval} = \mu \pm (Z \times \sigma) ]
Where:
μ = Population or sample mean
σ = Standard deviation
Z = Number of standard deviations (1, 2, or 3)
Breakdown:
Z = 1: Interval = μ ± σ → ~68% of data
Z = 2: Interval = μ ± 2σ → ~95% of data
Z = 3: Interval = μ ± 3σ → ~99.7% of data
For example, with μ = 100 and σ = 15:
1σ: 85 to 115
2σ: 70 to 130
3σ: 55 to 145
For more on probability zones, try our zone probability tool .
How to Use the Confidence Interval Calculator
This normal distribution interval calculator is simple and intuitive:
Enter the Mean (μ): Input your dataset’s average (e.g., 80 for exam scores).
Enter the Standard Deviation (σ): Specify the data spread (e.g., 10).
Choose the Interval: Select 1σ (68%), 2σ (95%), or 3σ (99.7%).
View Results: The tool calculates the lower and upper bounds of the confidence range.
Interpret: For example, “Approximately 95% of values fall between 60 and 100.”
For broader calculations, use our main statistics calculator .
Real-Life Examples of Empirical Rule Confidence Intervals
Example 1: IQ Scores
Mean (μ) = 100
Standard Deviation (σ) = 15
2σ Interval (95%): 100 ± (2 × 15) = 70 to 130
Interpretation: ~95% of the population has an IQ between 70 and 130.
Example 2: Exam Scores
Mean (μ) = 75
Standard Deviation (σ) = 8
1σ Interval (68%): 75 ± 8 = 67 to 83
Interpretation: ~68% of students scored between 67 and 83.
Example 3: Manufacturing Quality Control
Mean weight (μ) = 500g
Standard Deviation (σ) = 10g
3σ Interval (99.7%): 500 ± (3 × 10) = 470g to 530g
Interpretation: 99.7% of products weigh between 470g and 530g, ensuring quality standards.
These empirical rule application examples show practical use in population mean and variability analysis. For tail probabilities, try our tail probability tool .
Empirical Rule vs Confidence Interval (Statistical Difference)
| Aspect | Empirical Rule Interval | Statistical Confidence Interval |
|---|---|---|
| Purpose | Estimates where data falls in a normal distribution | Estimates where the true population mean lies |
| Based On | Known μ and σ | Sample mean and standard error |
| Example | 95% of data within μ ± 2σ | 95% chance the true mean is in the interval |
| Use Case | Data distribution analysis | Parameter estimation |
The empirical rule vs confidence interval distinction is key: this tool focuses on data range estimation, not parameter inference. Learn more in Empirical Rule vs. Confidence Intervals .
Advantages of Using the Empirical Rule for Confidence Intervals
Quick Estimation: No need for complex formulas or sample size data.
Visual Clarity: Shaded bell curves make 68-95-99.7 interpretation intuitive.
Educational Value: Ideal for teaching bell curve distribution concepts.
Practical Applications: Widely used in quality control, grading, and health metrics.
For margin of error calculations, try our margin calculator .
FAQs
A 1 sigma confidence interval is μ ± σ, containing ~68% of data in a normal distribution.
The empirical rule confidence interval estimates where data falls (e.g., 95% within μ ± 2σ), while statistical confidence intervals estimate the population mean.
No, the empirical rule applies only to normally distributed data. For non-normal data, use alternative methods.
A 95% empirical rule interval (μ ± 2σ) contains 95% of data. A 95% confidence level means 95% of intervals would contain the true mean if repeated.
They represent the area under the curve normal distribution within 1, 2, and 3 standard deviations, based on the 68-95-99.7 rule.
Related Statistical Tools
Empirical Rule vs. Confidence Intervals
Understand key differences, Empirical Rule vs. Confidence Intervals.
Try CalculatorConfidence Interval from Mean and Standard Deviation Calculator
Compute precise intervals Confidence Interval from Mean and Standard Deviation Calculator.
Try CalculatorMargin of Error Using Empirical Rule Calculator
Estimate error margins, Margin of Error Using Empirical Rule Calculator.
Try CalculatorEmpirical Rule Confidence Zone Visualizer
Visualize confidence zones on a bell curve, Empirical Rule Confidence Zone Visualizer.
Try CalculatorConclusion
The Empirical Rule Confidence Interval Calculator is your go-to tool for calculate range using empirical rule, offering fast, accurate estimates of where data lies in a normal distribution. With the 68-95-99.7 rule, it simplifies standard deviation confidence interval calculations for students, analysts, and educators. Whether analyzing test scores, manufacturing specs, or medical data, this probability interval calculator delivers clarity and insight. Start with our main statistics calculator to estimate your confidence interval now, or explore related tools like confidence zone visualizer , margin calculator , or interval difference guide for deeper statistical understanding.
Z-Score to Graph Plotter
Plot Z-scores on a bell curve and see where your value lies. Understand percentiles and probabilities at a glance.
Try CalculatorEmpirical Rule Percentile Calculator
Quickly estimate percentiles in a normal distribution using the 68-95-99.7 rule. Input mean, standard deviation, and a score to find its percentile rank.
Try CalculatorPercentile Rank Calculator
Find your score’s percentile rank without needing mean or standard deviation. Input your score and rank to see where you stand in any dataset.
Try CalculatorNormal Distribution to Percentile Visualizer
Visualize your score on a bell curve with shaded percentile areas. Enter mean, standard deviation, and a score to see its rank in a normal distribution.
Try Calculator