
Empirical Rule Extreme Value Finder
Extreme Values Analysis
↓ Extreme Low Values
↑ Extreme High Values
Statistical Summary
Interpretation & Actions
The empirical rule extreme value finder is a helpful tool that goes beyond simple outlier detection by ranking how unusual a data point is in a normal distribution. Using the empirical rule—also known as the 68-95-99.7 rule—it calculates the standard deviation distance from the mean and classifies values as moderately extreme, very extreme, or highly unusual. This extreme value empirical rule calculator is ideal for understanding distribution tails, where rare values hide.
Unlike binary outlier tools that just say “yes” or “no,” this finder shows the degree of extremeness, making it great for teaching, data exploration, and spotting severe deviations. It’s perfect for students analyzing test scores or analysts checking manufacturing data. For a basic start, try our Empirical Rule Calculator, or compare with the Empirical Rule Outlier Detector for yes/no checks.
What Counts as an “Extreme Value” Under the Empirical Rule?
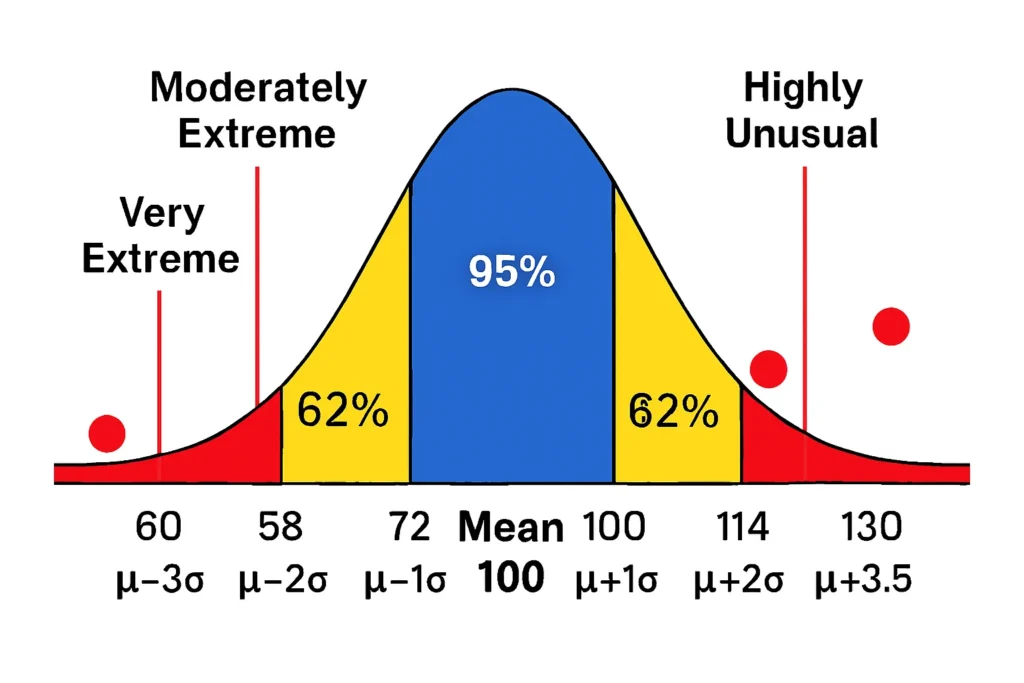
In a normal distribution, data mostly clusters near the mean, with fewer points in the tails. The empirical rule helps define extreme values by their distance from the mean in standard deviations (SD).
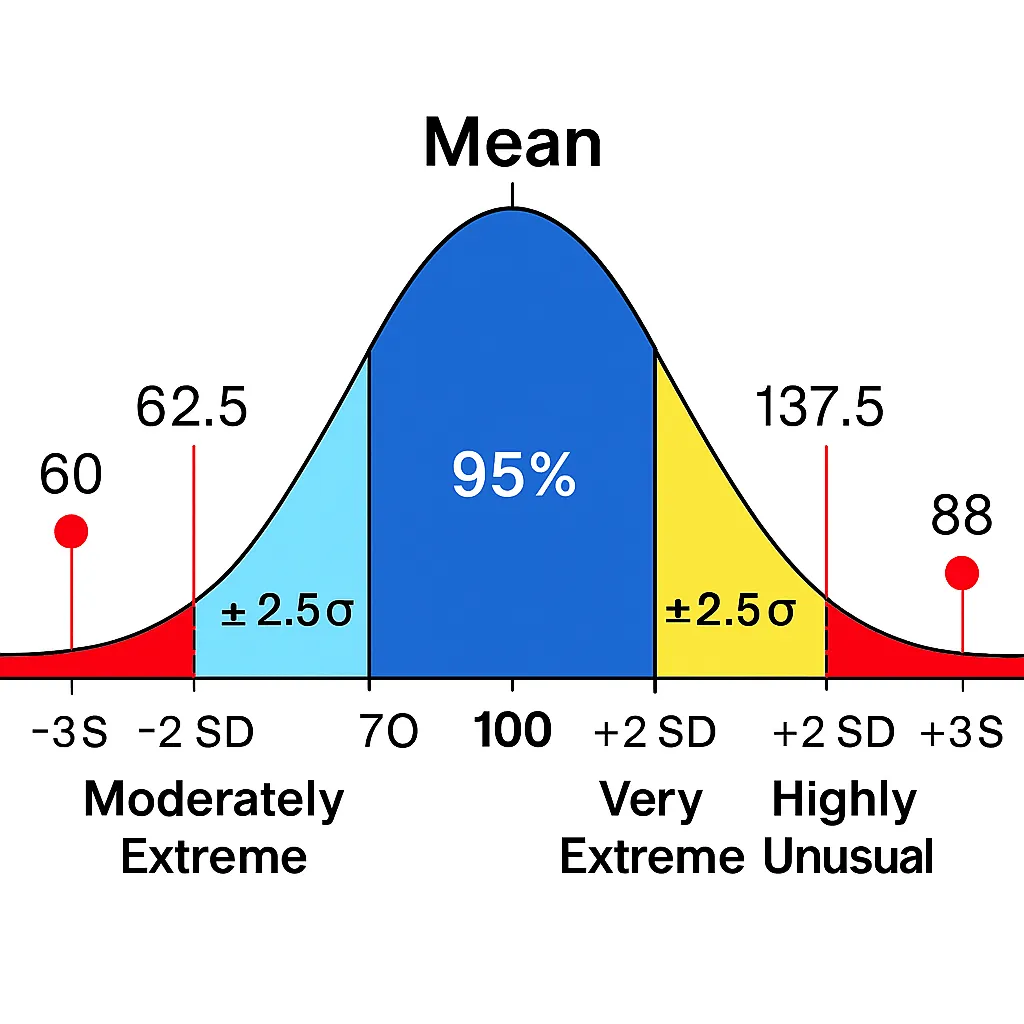
- Moderately Extreme: Beyond ±2 SD. This covers the outer 5% of data (beyond the central 95%), where values are unusual but not rare.
- Very Extreme: Beyond ±2.5 SD. Roughly the outer 1.2% (approximating ~98.8% within ±2.5 SD), indicating stronger deviation.
- Highly Unusual: Beyond ±3 SD. Only 0.3% of data falls here (beyond the 99.7% within ±3 SD), making these tail-end values truly rare.
These classifications highlight extreme tail values and their unusualness. For example, in IQ scores, a value beyond ±3 SD might represent genius-level or below-average extremes.
How the Extreme Value Finder Works
The extreme value finder simplifies checking how far a data point strays from the norm. It uses the empirical rule to rank extremeness without assuming all unusual values are errors.
Here’s the step-by-step process:
- Input the Mean and Standard Deviation: Enter the dataset’s average (mean) and spread (SD).
- Enter a Value or Dataset: Provide the point you want to check, or upload multiple for batch analysis.
- Calculate SD Distance: The tool computes the Z-score equivalent: (Value – Mean) / SD, showing SD distance.
- Assign Category: Based on absolute distance (|Z|):
2: Moderately extreme (beyond 2 SD).
2.5: Very extreme.
3: Highly unusual.
- Visualize on Bell Curve: The tool marks the value’s position, highlighting its tail placement.
This extreme standard deviation check focuses on ranking, not just flagging. It’s like an extreme z-score equivalent, helping you grasp how extreme is a data point in context.
Example Results
Let’s see the extreme data point finder in action with real-world examples. These show how it classifies unusual values in normal distribution scenarios.
Example 1: Test Scores
Mean = 70, SD = 8. Value = 88. SD Distance = (88 – 70) / 8 = 2.25. Classification: Moderately extreme (beyond 2 SD). Interpretation: This score is unusual, falling in the top 2.5% or so, perhaps indicating a high performer.
Example 2: IQ Scores
Mean = 100, SD = 15. Value = 145. SD Distance = (145 – 100) / 15 = 3. Classification: Highly unusual (beyond 3 SD). Interpretation: Extremely rare, occurring in about 0.1% of the population—could be a genius-level outlier.
Example 3: Athletic Performance (Sprint Times)
Mean = 50 seconds, SD = 10. Value = 75. SD Distance = (75 – 50) / 10 = 2.5. Classification: Very extreme (beyond 2.5 SD). Interpretation: Uncommonly slow, in the outer 0.6%—might signal an issue like fatigue.
Why Ranking Extremeness Is Better Than Simple Outlier Yes/No
Simple outlier tools often label anything beyond a threshold as “outlier,” but the extreme value finder ranks severity for deeper insights. This shows the degree of unusualness, like distinguishing a moderately extreme test score from a highly unusual one.
Benefits include:
- Nuanced Understanding: Reveals tail-end probability, helping see if a value is “unusual but possible” or “extremely rare.”
- Teaching Tool: Great for explaining normal distribution tails to students, showing how rarity increases with SD distance.
- Analyst Advantage: In data analysis, it highlights severity for better decisions, like prioritizing very extreme manufacturing defects.
- Contextual Tuning: Adjusts for field-specific needs, where “extreme” varies.
- Exploratory Power: Encourages probing why a value is highly unusual, not just flagging it.
This is why the Extreme Value Finder complements tools like the Empirical Rule Outlier Detector and the Outlier Threshold Calculator.
When to Use an Extreme Value Finder
The empirical rule extreme value finder shines in situations where understanding rarity matters more than a quick flag.
Use cases:
- Teaching Probability: Show students how beyond 2 SD values become progressively rare in a bell curve.
- Detecting Borderline Anomalies: Spot moderately extreme points that might not trigger strict outliers but warrant review.
- Quality Control: Rank deviations in weights or measurements to prioritize severe issues.
- Analyzing Rare Events: Evaluate athletic performance or IQ to see unusual values in normal distribution tails.
- Distinguishing Deviations: Separate mild from severe in exploratory data, like financial anomalies.
It’s a go-to for anyone needing SD distance classification without oversimplifying.
When the Method Should NOT Be Used
While useful, this method has limits and shouldn’t be applied blindly.
Avoid it when:
- Data Isn’t Normal: Skewed or bimodal distributions distort SD boundaries—rarity won’t match empirical rule percentages.
- Small Datasets: With few points, mean and SD are unreliable, leading to false extremeness rankings.
- Extreme Values Already Present: They can inflate SD, making everything seem less extreme.
- Non-Symmetric Data: Tails aren’t equal, so one side might over- or under-rank.
Always confirm data fits a normal curve first. You can verify normality first using the Normality Check Before Outlier Detection Tool.
FAQs
Using SD distance: beyond 2 SD is moderately extreme, beyond 2.5 SD very extreme, and beyond 3 SD highly unusual.
They align with empirical rule percentages: 5% beyond 2 SD, ~1.2% beyond 2.5 SD, and 0.3% beyond 3 SD for increasing rarity.
Not always—they’re highly unusual, but could be valid rare events; context matters.
No, it might indicate natural variation or something noteworthy, like exceptional performance.
Yes, it assumes a bell-shaped distribution; non-normal data skews rankings.
Related Tools
If a value appears highly unusual, compare it with thresholds from the Outlier Threshold Calculator or run a more detailed analysis using the Empirical Rule Outlier Detector. For guidance on spotting outliers, check How to Identify Outliers Using the Empirical Rule. Always start with the Normality Check Before Outlier Detection Tool to ensure your data fits. Explore basics at our Empirical Rule Calculator.
Conclusion
The empirical rule extreme value finder ranks how unusual values are by their SD distance, classifying them as moderately extreme, very extreme, or highly unusual. This helps uncover extreme tail values and their probabilities in normal distributions, from test scores to athletic data. It’s a fast, intuitive method for screening extremeness, but remember to check normality first.
Empirical Rule Calculator
Explore our statistical tools: calculate percentiles, visualize bell curves, and plot z-scores with simple, accurate calculators for normal distributions.
Try CalculatorEmpirical Rule Graph Generator
Visualize the 68-95-99.7 Rule with a bell curve showing standard deviation intervals. Great for quick insights and presentations.
Try CalculatorBell Curve Generator
Create customizable bell curve plots for any normal distribution. Perfect for data analysis and visual reports.
Standard Deviation Shading Calculator
Shade areas under the curve based on standard deviation. Instantly see data coverage between values.
Try Calculator