
Empirical Rule Probability Finder
Calculate probabilities based on the Empirical Rule (68-95-99.7) for normal distributions
About the Empirical Rule
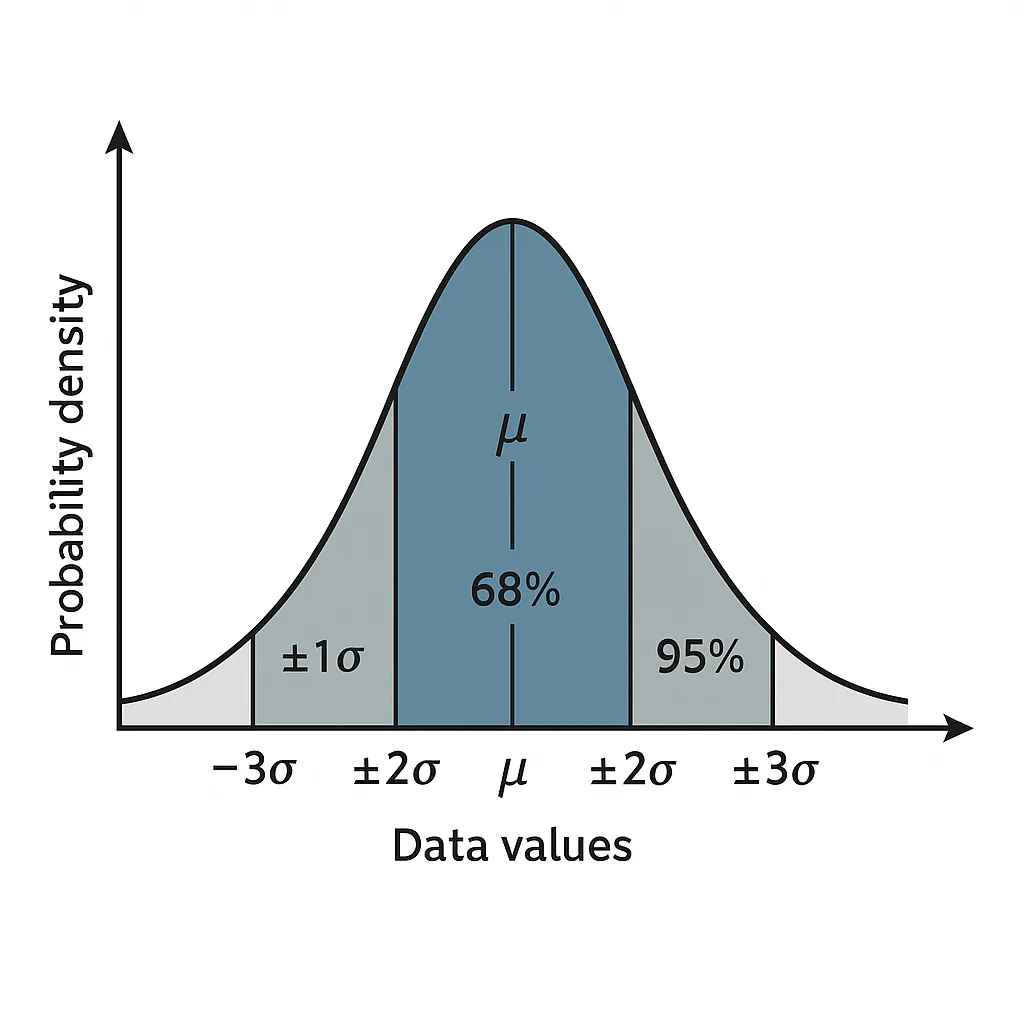
The Empirical Rule (also known as the 68-95-99.7 rule) is a statistical rule that applies to normal distributions:
- 68% of data falls within 1 standard deviation (μ ± 1σ)
- 95% of data falls within 2 standard deviations (μ ± 2σ)
- 99.7% of data falls within 3 standard deviations (μ ± 3σ)
Empirical Rule Calculator
Enter your distribution parameters and select a range to calculate probabilities
Results:
Probability within range: 68.27%
Range values: -1.00 to 1.00
Z-scores: -1.00 to 1.00
Range width: 2.00
Blue area represents the probability within the selected range
Usage Tips:
- Use this tool to quickly calculate probabilities for any normal distribution
- The custom range option allows you to calculate probabilities for any multiple of standard deviations
- The visual chart helps you understand the distribution and highlighted probability area
- All calculations are based on the standard normal distribution principles
The Empirical Rule Probability Finder is a powerful, user-friendly tool designed to calculate probabilities under a normal distribution using the 68-95-99.7 rule. Perfect for students, educators, and data analysts, this empirical rule calculator quickly estimates the probability under normal curve by inputting mean, standard deviation, and score ranges. With accurate results and visual bell curve outputs, it simplifies statistical analysis for exams, research, or data profiling. Enter your values below to find probabilities instantly and see the results on a shaded graph!
What Is the Empirical Rule (68-95-99.7 Rule)?
The empirical rule, also known as the 68-95-99.7 rule, describes how data spreads in a normal distribution, a bell-shaped curve where most values cluster around the mean. It states:
68% of data falls within one standard deviation (±1σ) of the mean.
95% falls within two standard deviations (±2σ).
99.7% falls within three standard deviations (±3σ).
This rule is a quick way to estimate probability within standard deviations in datasets like test scores or heights, assuming a normal distribution. For a deeper dive, explore our probability guide.
How to Use This Probability Finder Tool
The normal distribution probability calculator is simple to use and provides instant results:
Enter the Mean (μ): Input the dataset’s average (e.g., 100 for test scores).
Enter the Standard Deviation (σ): Specify the spread of data (e.g., 15).
Input Score Range or Single Score: Enter one or two scores to find the probability of data falling within that range (e.g., between 85 and 115) or below/above a single score.
Generate Results: The tool calculates the area under the bell curve using the empirical rule, displaying the probability as a percentage and a shaded graph showing the selected range.
Output: You’ll see the estimated probability (e.g., 68% for ±1σ) and a visual bell curve with the relevant area highlighted. This tool is ideal for quick approximations without needing a z-table.
Example: Finding Probability Between Two Z-Scores
Let’s walk through an empirical rule example problem:
Problem: A test has a mean of 100 and a standard deviation of 15. What’s the probability a score is between 85 and 115?
Step-by-Step:
Calculate Z-Scores:
For 85: ( Z = \frac{85 – 100}{15} = -1 )
For 115: ( Z = \frac{115 – 100}{15} = 1 )
Apply Empirical Rule: The range from -1σ to +1σ covers 68% of the data.
Tool Output: Enter mean = 100, standard deviation = 15, and range 85–115. The tool confirms a 68% probability, with a shaded bell curve highlighting the area.
Manual Method: You’d estimate the same 68% using the empirical rule, but the tool saves time and visualizes the bell curve probability zones. For precise calculations, try our z-score tool .
Who Should Use This Tool?
The Empirical Rule Probability Finder is designed for:
Students: Learning normal distributions in AP Statistics or college courses.
Teachers: Demonstrating the 68-95-99.7 rule with interactive visuals.
Test-Prep Candidates: Interpreting SAT or GRE score probabilities.
Data Scientists: Profiling data distributions in initial analyses.
This tool makes statistics for beginners accessible by simplifying standard deviation and probability calculations. For visualizing probabilities, check our probability visualizer .
Empirical Rule vs Exact Z-Table Probability
The empirical rule offers quick approximations for probability under normal curve, but how does it compare to z-tables?
Empirical Rule: Best for estimating probabilities within ±1σ, ±2σ, or ±3σ in normal distributions. It’s fast and doesn’t require lookup tables.
Z-Table: Provides exact probabilities for any z-score but requires manual lookup or software.
When to Use Empirical Rule: For normally distributed data with large samples (n > 30), when quick estimates suffice.
Limitations: Inaccurate for skewed distributions, small samples, or probabilities outside ±3σ. In such cases, use a z-table or our tail probability tool .
The empirical rule shines for its simplicity, unlike empirical rule vs Chebyshev’s theorem, which applies to non-normal data but gives less precise estimates.
Related Tools
Enhance your statistical analysis with these tools:
-
Empirical Rule Calculator: Calculate probabilities and ranges using the 68-95-99.7 rule for normal distributions .
-
How to Find Probability Using the Empirical Rule: Learn step-by-step methods for empirical rule probability calculations .
-
Left-Tail/Right-Tail Probability Calculator: Compute probabilities in the tails of a normal distribution .
-
Probability to Z-Score Approximation Tool: Convert probabilities to approximate z-scores for normal distributions .
-
Probability Estimator Using Rule Zones: Estimate probabilities for specific standard deviation zones in a bell curve .
FAQs
Using the 68-95-99.7 rule, about 68% of data falls within one standard deviation (±1σ) of the mean in a normal distribution.
Yes, IQ and SAT scores often follow a normal distribution, making the empirical rule probability finder ideal for estimating probabilities, like the chance of scoring between 1000 and 1200 on the SAT.
No, it’s only accurate for normally distributed data with large samples. For non-normal data, consider empirical rule vs Chebyshev’s theorem or other methods.
Probability is the likelihood of a value occurring (e.g., 68% chance of a score within ±1σ), while percentile ranks a value’s position (e.g., 84th percentile for z = 1). Learn more with our probability guide [How to Find Probability Using the Empirical Rule].
The normal distribution table vs empirical rule shows exact probabilities for any z-score, but this tool offers quick approximations with visual outputs for ±1σ, ±2σ, or ±3σ.
Conclusion
The Empirical Rule Probability Finder simplifies finding probability within standard deviations in a normal distribution, making it a go-to tool for students, educators, and analysts. By leveraging the 68-95-99.7 rule, it delivers fast, accurate probability estimates with clear, shaded bell curve visuals. Whether you’re tackling empirical rule example problems for a stats class or profiling data, this tool makes mean and standard deviation in normal distribution intuitive. Try our main statistics calculator to calculate probabilities now, or explore related tools like the tail probability tool , z-score approximator , zone estimator , or our probability guide for deeper insights.
Check Our Other Tools:
Empirical Rule Percentile Calculator
Quickly estimate percentiles in a normal distribution using the 68-95-99.7 rule. Input mean, standard deviation, and a score to find its percentile rank.
Try CalculatorZ-Score to Percentile Converter
Convert a z-score to a percentile in a normal distribution. Enter your z-score to see the percentage of data below it, ideal for test scores or analytics.
Try CalculatorPercentile Rank Calculator
Find your score’s percentile rank without needing mean or standard deviation. Input your score and rank to see where you stand in any dataset.
Try CalculatorNormal Distribution to Percentile Visualizer
Visualize your score on a bell curve with shaded percentile areas. Enter mean, standard deviation, and a score to see its rank in a normal distribution.
Try Calculator