
Margin of Error Using Empirical Rule Calculator
Margin of Error
±1.50
Calculation Details
95% (±2σ)
2
15
100
-
Interpretation
Enter values and click calculate to see the interpretation.
Confidence Interval Range
Enter values and click calculate to see the confidence interval range.
Formula Used
MOE = Z × (σ / √n)
Where:
- MOE = Margin of Error
- Z = Z-score based on confidence level (1, 2, or 3)
- σ = Population standard deviation
- n = Sample size
- σ/√n = Standard Error of the mean
Note: The margin of error decreases as sample size increases, and increases with higher confidence levels.
The margin of error empirical rule calculator helps you quickly determine how far data typically varies from the mean in a normal distribution using the 68-95-99.7 rule. By entering the mean and standard deviation, you instantly get the margin of error for 68%, 95%, or 99.7% coverage — ideal for students, educators, and analysts learning descriptive statistics. Unlike survey-based margins, this tool uses population spread to estimate data precision and accuracy. Once you have your margin of error, plug it into our interval calculator to visualize the full range.
Author:
Prof. Ayesha Khan, M.Sc. Statistics, 12+ years teaching AP Statistics and data analysis.
What Is Margin of Error in Statistics?
The margin of error is the distance from the mean within which a certain percentage of data is expected to fall. In the Empirical Rule, it represents half the width of a confidence range based on standard deviation.
For example:
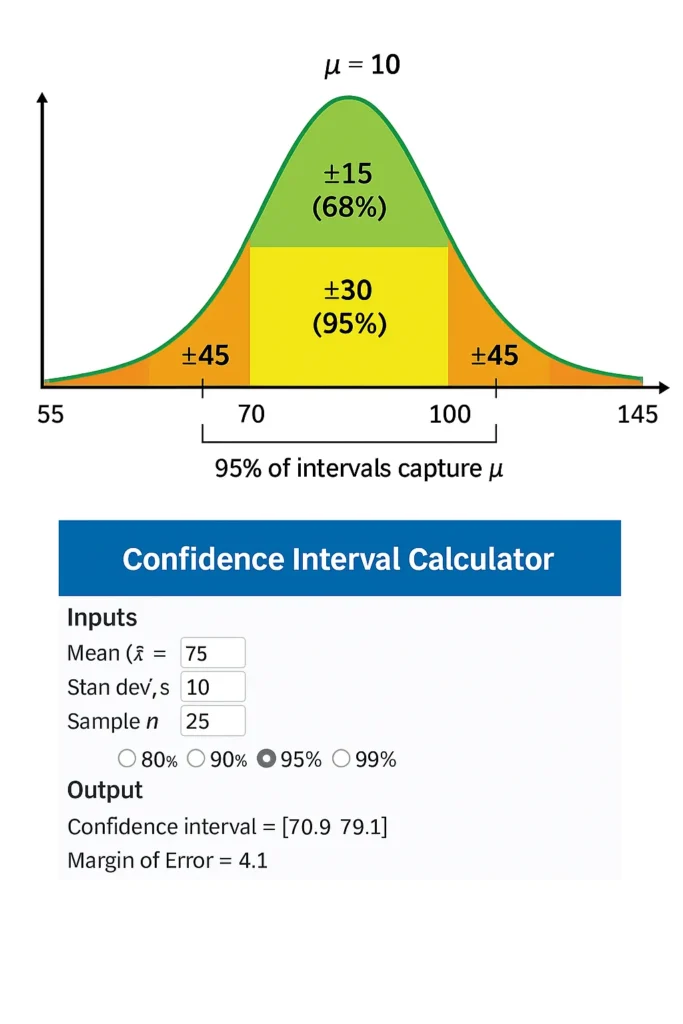
If the mean is 100 and SD is 15, a 95% confidence range (±2σ) goes from 70 to 130. The margin of error is 30 — meaning values are typically within ±30 of the mean.
This is a descriptive measure of statistical spread of data, not an inferential estimate from sampling.
The Empirical Rule (68–95–99.7 Rule)
The Empirical Rule applies to normally distributed data and states:
68% of values fall within 1 standard deviation (mean ± 1σ)
95% within 2 standard deviations (mean ± 2σ)
99.7% within 3 standard deviations (mean ± 3σ)
These are normal curve probability zones that help estimate data range without complex calculations.
Formula for Margin of Error Using Empirical Rule
The formula is simple:
[ \text{Margin of Error} = Z \times \sigma ]
Where:
-
( Z ) = Empirical multiplier (1, 2, or 3)
-
( \sigma ) = Standard deviation
| Confidence Level | Z-Value | Coverage | Formula Example (SD = 15) |
|---|---|---|---|
| 68% | 1 | Mean ± 1σ | ±15 |
| 95% | 2 | Mean ± 2σ | ±30 |
| 99.7% | 3 | Mean ± 3σ | ±45 |
How to Use the Calculator
Follow these steps to calculate margin of error using standard deviation:
Enter Mean (μ): The average of your dataset (e.g., 80).
Enter Standard Deviation (σ): The measure of spread (e.g., 5).
Choose Confidence Level: Select 68%, 95%, or 99.7%.
Get Results: The calculator outputs the margin of error (e.g., ±10 for 95%).
Quick Example:
Mean = 100, SD = 15, 95% selected →
Margin of Error = 2 × 15 = ±30
No sample size needed — this is population-based, not survey-based.
Why Use the Empirical Rule for Margin of Error
Fast & Visual: No z-tables or t-scores required.
Educational: Perfect for learning 1 sigma 2 sigma 3 sigma relationships.
Descriptive Accuracy: Ideal for normally distributed population data.
Real-World Fit: Used in quality control, grading curves, and performance metrics.
For inferential needs, try our confidence calculator .
Limitations of the Empirical Method
Assumes Normality: Only works well for bell curve distribution.
Descriptive Only: Does not account for sampling error.
Not for Surveys: Use standard error and sample size for poll margins.
Approximate: The 95% rule is close but not identical to a 95% confidence interval.
Note: This is not the same as survey margin of error. For sample-based inference, use a t-distribution calculator.
Example Problem
A factory measures product length:
Mean = 50 cm, SD = 2 cm
Using the empirical rule margin of error:
68% coverage: Margin = 1 × 2 = ±2 cm → 48–52 cm
95% coverage: Margin = 2 × 2 = ±4 cm → 46–54 cm
99.7% coverage: Margin = 3 × 2 = ±6 cm → 44–56 cm
This means 95% of products are within ±4 cm of the target length.
Related Tools
Enhance your analysis with these calculators:
Empirical Rule Confidence Interval Calculator: Build full ranges from your margin
Empirical Rule Probability Finder: Explore probability in each zone
Empirical Rule Confidence Zone Visualizer: See shaded intervals on a bell curve
Confidence Interval from Mean and Standard Deviation Calculator: For sample-based inference ator]
FAQs
[ \text{Margin of Error} = Z \times \sigma ] where ( Z = 1, 2, ) or ( 3 ) for 68%, 95%, or 99.7% coverage.
Use 1σ for typical variation (68%), 2σ for reliable range (95%), 3σ for nearly all data (99.7%).
No. Survey margins use standard error (( \frac{\sigma}{\sqrt{n}} )) and sample size. This is population-based.
Only to approximately normal data. Check for bell-shaped symmetry first.
Empirical describes population spread. Inferential estimates sampling uncertainty for population parameters.
Conclusion
The margin of error empirical rule calculator makes it easy to find margin of error from mean and SD using the 68-95-99.7 rule, offering a fast, visual way to understand data precision in normal distributions. Whether you’re a student learning standard deviation and confidence range or an analyst summarizing population vs sample spread, this tool delivers clarity without complexity. Once you have your margin of error, plug it into our Empirical Rule Confidence Interval Calculator to visualize the complete confidence range. For sampling-based precision, explore our Confidence Interval from Mean and Standard Deviation Calculator. Check Our Main Tool.
Empirical Rule Calculator
Explore our statistical tools: calculate percentiles, visualize bell curves, and plot z-scores with simple, accurate calculators for normal distributions.
Try CalculatorEmpirical Rule Graph Generator
Visualize the 68-95-99.7 Rule with a bell curve showing standard deviation intervals. Great for quick insights and presentations.
Try CalculatorBell Curve Generator
Create customizable bell curve plots for any normal distribution. Perfect for data analysis and visual reports.
Standard Deviation Shading Calculator
Shade areas under the curve based on standard deviation. Instantly see data coverage between values.
Try Calculator