
Percentile vs. Probability: What’s the Difference?
Percentiles and probabilities are often confused, but they’re distinct statistical concepts with different purposes. A percentile shows your rank compared to others, while a probability tells you the likelihood of an event. This article breaks down the difference between percentile and probability, using examples and visuals to make these ideas clear for students, test-takers, educators, and analysts. Whether you’re analyzing SAT scores or predicting outcomes, understanding these concepts is key. Want to explore related tools? Check out our main statistics calculator for hands-on calculations.
What Is a Percentile?
A percentile indicates your position in a dataset, showing what percentage of values are below yours. If your score is in the 80th percentile, you outperformed 80% of the group. It’s a ranking tool, always based on comparison to others.
Example: If your SAT score is in the 90th percentile, you scored better than 90% of test-takers. This means your score ranks high, but it doesn’t tell you the chance of getting that score again. For more on percentile rankings, see our rank calculator.
Percentiles are widely used in education, testing, and performance evaluations because they show relative standing in a clear, intuitive way.
What Is Probability?
Probability measures the likelihood that a specific value or range of values occurs in a dataset. In statistics, it’s often represented as the area under normal curve vs percentile, showing the chance of an event happening. It’s expressed as a percentage, decimal, or fraction and focuses on predicting outcomes, not ranking.
Example: In a normal distribution of IQ scores with a mean of 100 and a standard deviation of 15, the probability that a randomly selected person’s IQ is between 85 and 115 is about 68%. This reflects the 68-95-99.7 rule for normal distributions. To calculate such probabilities, try our percentile tool .
Key Differences Between Percentile and Probability
Here’s a clear comparison to highlight the percentile vs probability in statistics:
| Feature | Percentile | Probability |
|---|---|---|
| Definition | Rank relative to others | Likelihood of an outcome |
| Based On | Cumulative distribution up to a point | Range or single value in distribution |
| Expressed As | Percentage rank (e.g., 80th percentile) | Likelihood (e.g., 68%, 0.68) |
| Example | 85th percentile = better than 85% | P(90 < X < 110) = 68% |
Percentiles focus on your position, while probabilities predict event likelihood. For visualizing these, explore our distribution visualizer .
Visualizing the Difference (Use Normal Distribution)
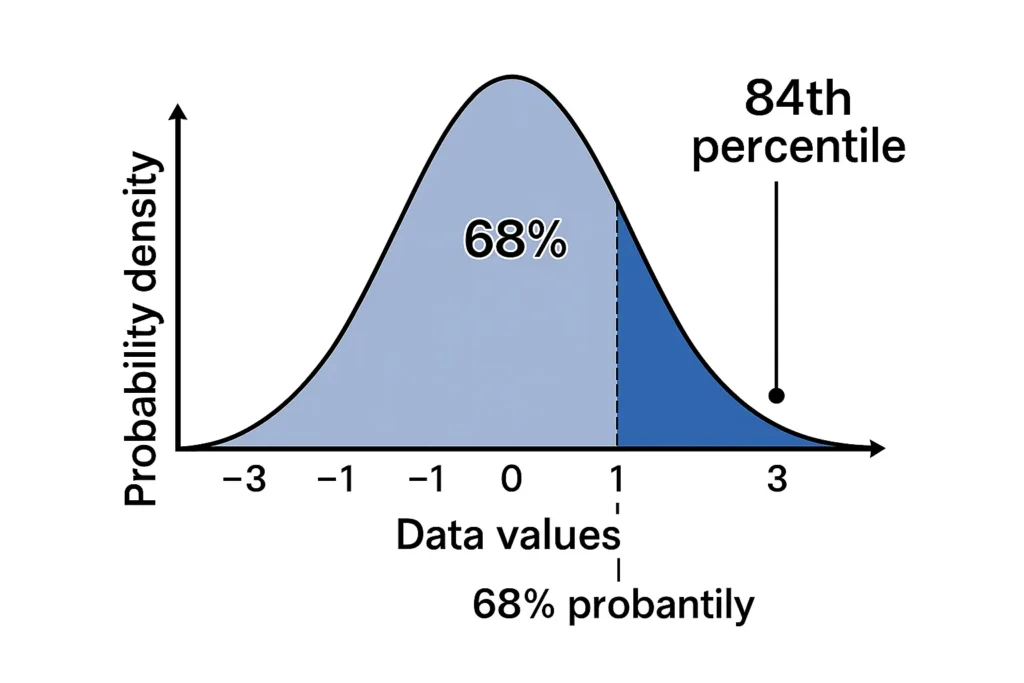
A normal distribution forms a bell-shaped curve, and both percentiles and probabilities can be visualized on it:
Probability: Represented by the shaded area under the curve for a range of values. For example, in a normal distribution with mean = 100 and standard deviation = 15, the area between 85 and 115 represents a 68% probability of a value falling in that range.
Percentile: Shown as the cumulative area under the curve up to a single point. For a score of 115 (z-score = 1), the shaded area to the left is the 84th percentile, meaning 84% of data is below that score.
Common Misunderstandings
A frequent mistake is thinking a percentile is the probability of getting a score. For example:
Misunderstanding: If you’re in the 80th percentile, it does NOT mean there’s an 80% chance you’ll score that high again.
Correct Understanding: The 80th percentile means 80% of the group scored below you. Probability predicts future outcomes, while percentile ranks past performance.
Probability is for predictions (e.g., chance of rain), while percentile is for comparisons (e.g., your rank in a race). To see how percentiles apply in practice, check out real-world percentile uses .
When to Use Which?
Choosing between percentile and probability depends on your goal:
| Use Case | Use Percentile | Use Probability |
|---|---|---|
| Comparing test scores | ✅ | ❌ |
| Calculating chance of an event | ❌ | ✅ |
| Educational assessments | ✅ | Sometimes |
| Probability modeling/simulation | ❌ | ✅ |
Percentile: Use for ranking, like comparing SAT scores or employee performance.
Probability: Use for predicting outcomes, like the chance a product meets specs.
Real-World Examples
College Admissions: Admissions officers use percentiles to compare applicants’ test scores. A 95th percentile SAT score means a student outperformed 95% of test-takers, helping them stand out.
Quality Control: A factory calculates the probability that a product’s weight falls within 1 standard deviation of the mean (68%) to ensure quality standards.
Medical Tests: A child’s weight in the 75th percentile means they’re heavier than 75% of peers, while a probability of 10% for a high cholesterol level flags potential health risks.
FAQs
No, a percentile ranks your position relative to others, while probability measures the likelihood of an event. They’re related but distinct.
Sometimes, like the 84th percentile aligning with an 84% cumulative probability up to z = 1 in a normal distribution, but they represent different concepts.
In a normal distribution, you can derive percentiles from probabilities using z-scores, but the context matters. Use a percentile calculator [Empirical Rule Percentile Calculator] for conversions.
A test score in the 90th percentile means you scored better than 90% of others. A 90% probability means there’s a 90% chance of an event, like a score falling in a range.
Use percentiles for ranking (e.g., test scores). Use probability for predicting outcomes (e.g., chance of a value occurring).
Conclusion
Understanding the percentile vs probability distinction is crucial for navigating statistics. Percentiles rank your position in a group, like scoring in the 80th percentile on a test, while probabilities predict the likelihood of outcomes, like a 68% chance of a value in a range. Both are vital for interpreting data, whether in education, quality control, or medical analysis. The probability and percentile examples in this guide show how they work together in normal distributions. Explore these concepts further with our main statistics calculator, percentile calculator , z-score converter , rank calculator , distribution visualizer , or real-world percentile uses for a deeper statistical understanding.
Empirical Rule Graph Generator
Visualize the 68-95-99.7 Rule with a bell curve showing standard deviation intervals. Great for quick insights and presentations.
Try CalculatorBell Curve Generator
Create customizable bell curve plots for any normal distribution. Perfect for data analysis and visual reports.
Standard Deviation Shading Calculator
Shade areas under the curve based on standard deviation. Instantly see data coverage between values.
Try CalculatorZ-Score to Graph Plotter
Plot Z-scores on a bell curve and see where your value lies. Understand percentiles and probabilities at a glance.
Try Calculator