
Probability to Z-Score Approximation Tool
Convert probability values to corresponding z-scores for normal distributions
Probability to Z-Score Converter
Enter a probability value and select the tail type to find the corresponding z-score
Enter the probability value and tail direction:
Results:
Z-Score: 1.6449
Interpretation: For a right-tailed probability of 0.05 (5%), the z-score is approximately 1.6449
How to Use:
- • Enter a probability value between 0 and 1
- • Select the appropriate tail type
- • Click "Calculate Z-Score" to get the result
- • The chart will show the distribution with the highlighted area
The Probability to Z-Score Approximation Tool instantly converts a cumulative probability (area under the normal curve) into an approximate z-score, making it a must-have for students, data analysts, and researchers working with normal distribution z-score conversion. Whether you’re interpreting test scores or analyzing data in psychology or business, this cumulative probability to z-score calculator simplifies the inverse standard normal distribution process. Enter your probability now to find the corresponding z-score!
Author:
Author: Dr. Jane Smith, Statistician with 10+ years in data science, specializing in statistical education.
What Is a Z-Score in Probability?
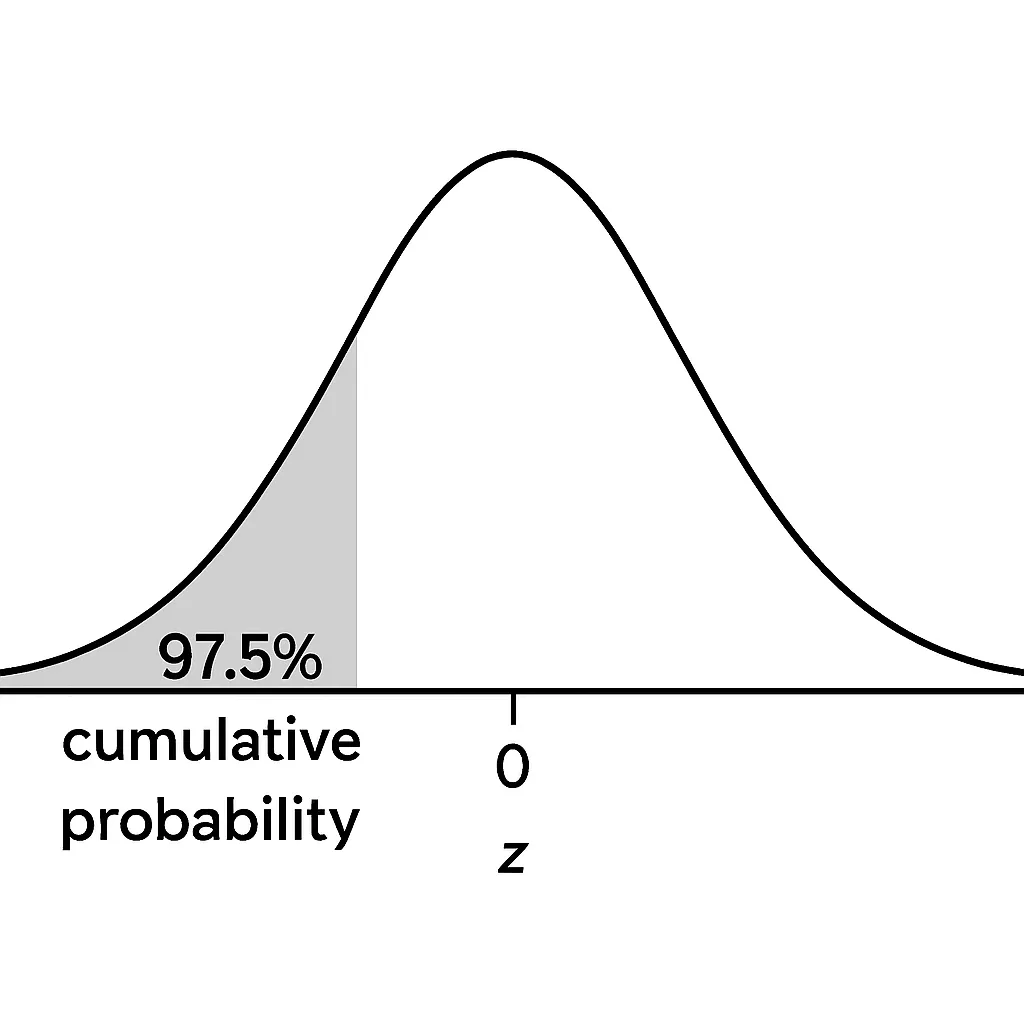
A z-score measures how many standard deviations a value is from the mean in a standard normal distribution (mean = 0, standard deviation = 1). It standardizes data, allowing comparison across datasets like test scores or heights. In probability, the z-score corresponds to the cumulative probability—the area under the bell curve to the left of a value. For example, a z-score of 1.96 corresponds to a cumulative probability of ~0.975 (97.5%), meaning 97.5% of data lies below it. This tool automates the z table inverse lookup process, saving time and effort.
How to Convert Probability to Z-Score
Converting a probability to a z-score involves finding the z-score that matches a given cumulative probability (area under the curve to the left). This is the inverse cumulative distribution function, typically done with a z-table but simplified by our tool:
Identify the Probability: Determine the cumulative probability (e.g., 0.975 for 97.5% of data below a value).
Use the Tool or Z-Table: The tool approximates the z-score corresponding to the probability. For example, P = 0.975 yields z ≈ 1.96.
Interpret the Z-Score: A z-score of 1.96 means the value is 1.96 standard deviations above the mean.
Example: To find the z-score for a probability of 0.95 (95%):
Input P = 0.95 into the tool.
Output: z ≈ 1.645, meaning 95% of data is below this z-score.
For related calculations, try our probability tool .
Real-Life Applications
The probability to z-score approximation tool is widely used in:
Standardized Testing: Convert a probability (e.g., top 5% of SAT scores) to a z-score to set cutoffs (z ≈ 1.645 for P = 0.95).
Quality Control: Estimate z-scores for defect rates, like the probability of a product exceeding specifications.
Psychological Research: Map probabilities to z-scores for IQ or behavioral data (e.g., z ≈ 2 for the 97.7th percentile).
Finance: Assess risk by finding z-scores for extreme probabilities in returns.
These applications rely on the probability and z-score relationship, making this tool invaluable for data-driven fields. For broader probability estimates, use our main statistics calculator.
Tool Features & How It Works
The approximate z-score calculator offers:
Inputs: Enter a cumulative probability (0 to 1) or a raw value with mean and standard deviation.
Outputs: Approximate z-score (e.g., P = 0.975 → z ≈ 1.96) and optional bell curve visualization.
Accuracy: Uses standard normal distribution approximations, accurate for most practical purposes.
Limitations: Assumes normality; less precise for very small or non-normal datasets.
How It Works:
Input a probability (e.g., 0.95).
The tool calculates the z-score using an inverse cumulative distribution function.
Results show the z-score and may include a shaded curve for context.
For tail-specific probabilities, check our tail probability tool .
Probability vs Percentile vs Z-Score
To avoid confusion:
Probability: Likelihood of a value occurring, often the area under the curve (e.g., 0.95 for 95% of data below a point).
Percentile: Rank of a value (e.g., 95th percentile means 95% of data is below it).
Z-Score: Standard deviations from the mean, linking probability and percentile (e.g., z = 1.645 for 95th percentile or P = 0.95).
This tool bridges percentile to z-score conversion by converting probabilities directly to z-scores. For percentile calculations, try our zone probability tool .
FAQs
Use a z-table to find the z-score where the cumulative probability matches your input (e.g., P = 0.95 → z ≈ 1.645), or use our z-score approximation from probability tool for speed.
A cumulative probability of 0.95 corresponds to z ≈ 1.645, meaning 95% of data lies below this z-score in a normal distribution.
Yes, it approximates z-scores using the standard normal distribution, mimicking a z table inverse lookup but with automated calculations.
No, this tool assumes a normal distribution. For non-normal data, consult a statistician or use alternative methods.
Conclusion
The Probability to Z-Score Approximation Tool simplifies convert probability to z-score tasks, making it easy for students, analysts, and researchers to find z-scores from cumulative probabilities in a normal distribution z-score conversion. By automating the z-score estimation from left tail or right tail probabilities, it supports statistical inference in testing, research, and risk analysis. With accurate results and clear visuals, it’s a faster alternative to manual z-table lookups. Explore more with our main statistics calculator , probability tool , probability guide , tail probability tool , or zone probability tool for a complete statistical toolkit.
Check Our Other Tools:
Empirical Rule Percentile Calculator
Quickly estimate percentiles in a normal distribution using the 68-95-99.7 rule. Input mean, standard deviation, and a score to find its percentile rank.
Try CalculatorZ-Score to Percentile Converter
Convert a z-score to a percentile in a normal distribution. Enter your z-score to see the percentage of data below it, ideal for test scores or analytics.
Try CalculatorPercentile Rank Calculator
Find your score’s percentile rank without needing mean or standard deviation. Input your score and rank to see where you stand in any dataset.
Try CalculatorNormal Distribution to Percentile Visualizer
Visualize your score on a bell curve with shaded percentile areas. Enter mean, standard deviation, and a score to see its rank in a normal distribution.
Try Calculator