
Standard Deviation Percentage Contribution Calculator
Each value's contribution to overall variance will be calculated
Contribution Analysis
Individual Contributions (Sorted by Impact)
Top Contributors
Interpretation
The sd percentage contribution calculator is a conceptual tool that reveals how much of a normal distribution’s total variance comes from different standard deviation (SD) bands, such as 0–1σ, 1–2σ, 2–3σ, and beyond 3σ. It breaks down variance—the average squared deviation from the mean—into percentage shares per band, helping you see the “spread energy” across the distribution.
This isn’t a probability calculator like the empirical rule; instead, it focuses on variance contribution, where farther bands amplify their impact due to squared distances. It’s great for building an intuitive grasp of why tails matter in variance, even if they’re rare. To explore related ideas, see our Variance Distribution Analyzer and Standard Deviation Importance Score Calculator.
What Is Standard Deviation Percentage Contribution?
Standard deviation (SD) measures how spread out data is from the mean, while variance is SD squared—the average of those squared deviations. Standard deviation percentage contribution looks at how much each SD band (like 0–1σ or 1–2σ) adds to the total variance in a normal distribution.
These bands divide the bell curve into zones. The central 0–1σ band has high data density but small deviations, so it contributes a lot to variance. Outer bands have lower density but larger squared deviations, balancing their share. This differs from probability, where the center dominates overwhelmingly.
Variance contribution highlights the structure of spread, showing why extreme points punch above their weight. For beginners, think of variance as the “budget” of variability—each band gets a percentage slice based on density times squared distance.
How Variance is Distributed Across Standard Deviations
In a normal distribution, variance isn’t evenly spread—it’s concentrated where density and deviation balance. The 0–1σ band, closest to the mean, has the highest point density, so even small deviations add up to a big variance share.
The 1–2σ band has moderate density but larger deviations, contributing nearly as much. By 2–3σ, density drops, but squared distances grow, keeping a notable slice. Beyond 3σ, rare tails still contribute because extreme deviations square to huge numbers.
This variance distribution calculator shows why removing tails lowers SD more than expected. It’s key for understanding normal distribution variance density, where central mass drives most spread.
If you shade the bell curve between −1σ and +1σ, that region is dense with points. Even though the squared distance is smaller, its high density means it contributes ~42% of total variance.
Formula Logic Behind SD Band Contribution
The sd percentage contribution calculator uses integral logic to apportion variance. Conceptually, total variance is the integral of squared deviations weighted by density across the entire distribution.
For a specific SD band, contribution percentage = [integral over band of (x – μ)^2 * f(x) dx] / [total variance] * 100.
Here, μ is the mean, f(x) is the normal density function, and bands are intervals like 0 to 1σ from the mean (symmetric on both sides).
Because deviation is squared, values further from the mean—even if rare—have amplified influence on variance. This explains why tails in variance explained by SD ranges aren’t negligible.
For a standard normal (μ=0, σ=1), the formula simplifies, but the calculator scales it for any mean/SD.
Example: Variance Contribution Breakdown
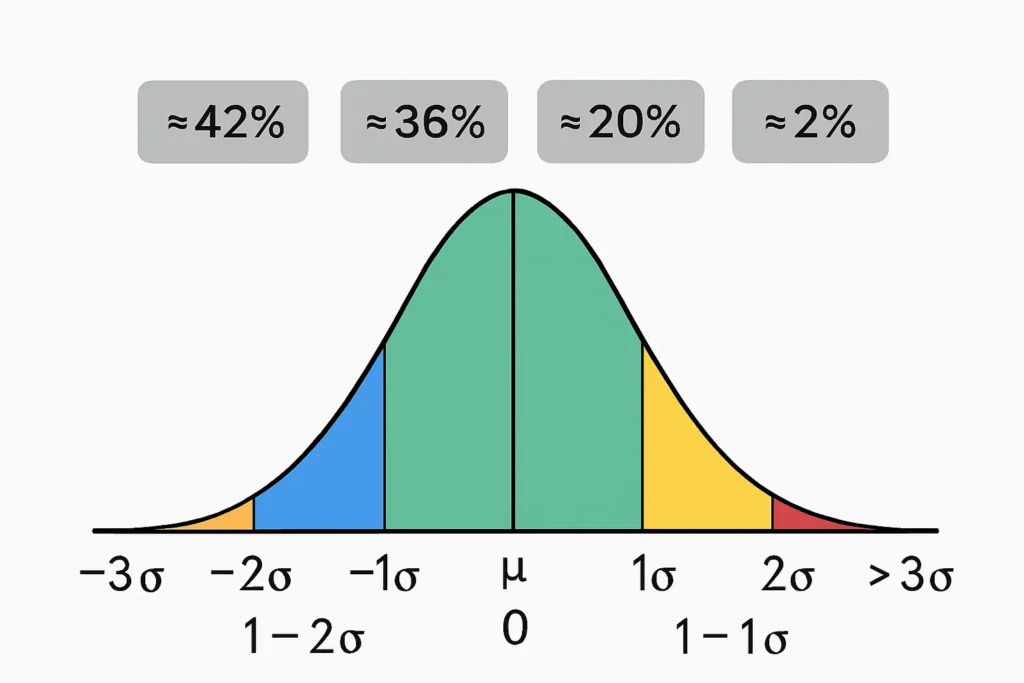
Let’s look at a standard normal distribution example with the sd percentage contribution calculator. Assuming μ=0 and σ=1, the breakdown is:
| SD Band | Approx % Contribution |
|---|---|
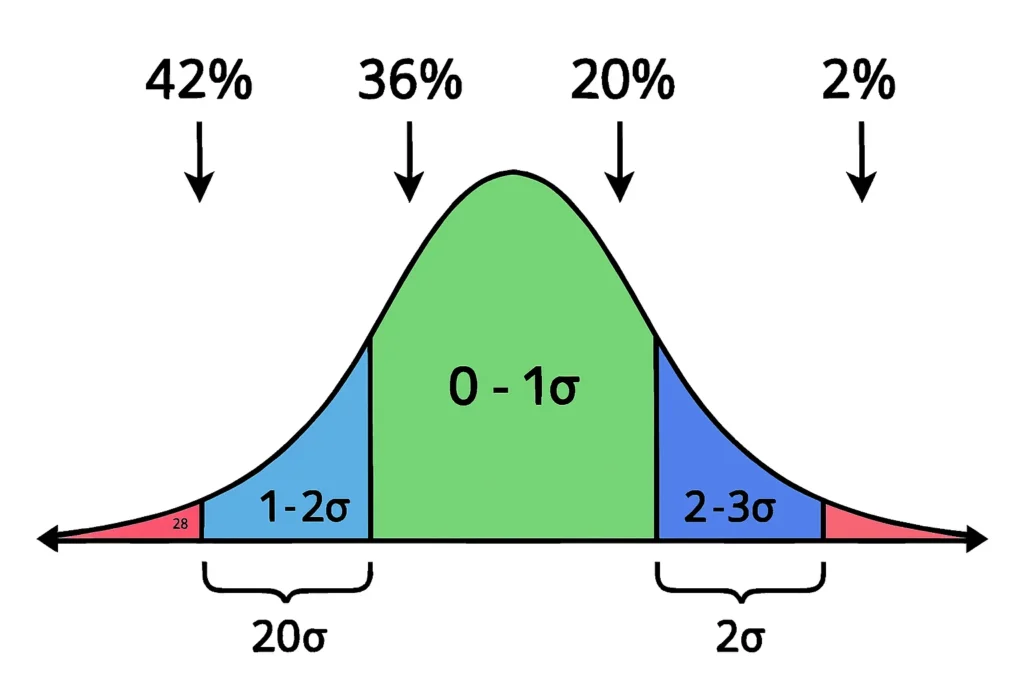
| 0–1 SD | ~42% |
| 1–2 SD | ~36% |
| 2–3 SD | ~20% |
| >3 SD | ~2% |
The central 0–1 SD contributes the most because of high density near the mean—many points with small but cumulative squared deviations. The 1–2 SD adds nearly as much, balancing lower density with bigger deviations.
By 2–3 SD, contribution drops as rarity outweighs distance, and >3 SD is minimal but present due to extreme squared values. This variance contribution by standard deviation shows the bell’s structure.
In a real scenario, like exam scores (μ=75, σ=10), the percentages hold the same ratios, scaled by σ².
Variance Contribution vs Probability Contribution
Variance and probability both describe normal distributions but differently. Probability measures how likely values are (density), while variance contribution weighs that by squared deviation for spread.
| Feature | Probability | Variance Contribution |
|---|---|---|
| Measures | How many values | How much spread |
| Highest in | Center | Center & mid SD bands |
| Tails | Almost zero | Still contribute |
| Based on | Density | Squared distance × density |
| Purpose | Empirical rule understanding | Variance structure understanding |
Probability peaks at the mean, with tails near zero. Variance amplifies tails because extremes square large.
On a probability plot, the tails look almost empty. But on a variance plot, the tails light up because their values are far from the mean. This highlights empirical rule vs variance contribution—probability for frequency, variance for impact.
When Should You Use This Calculator?
The sd percentage contribution calculator is ideal for educational and analytical scenarios where understanding variance breakdown matters.
Use it for:
- Teaching SD & variance behavior in intro stats classes, showing why outliers inflate variance.
- Understanding why SD rises with extreme points in data analysis.
- Demonstrating normal distribution structure for teachers or tutors.
- Data literacy training, explaining central vs tail contribution.
- Interpreting variance in fields like finance or quality control, where spread dynamics are key.
It’s a great conceptual aid for beginners grasping variance vs probability.
Limitations
This calculator assumes a theoretical normal distribution, so it won’t analyze raw datasets directly—use it for conceptual insights.
It doesn’t compute probabilities, detect outliers, or handle non-normal data, where variance distribution varies. Real datasets may deviate due to skewness or kurtosis, so percentages are approximate.
For non-ideal data, pair with normality checks. It’s educational, not for precise empirical applications.
FAQs
It shows the percentage of total variance each standard deviation range (like 0–1σ) adds in a normal distribution.
High data density near the mean creates many small squared deviations that add up significantly.
Rare extreme values have large squared deviations, amplifying their variance impact despite low frequency.
No, the empirical rule covers probability percentages; variance focuses on spread contribution.
Approximately in normal data, but real sets may vary due to non-normality—use for conceptual learning.
Related Tools
For hands-on variance exploration, check our Understanding Percentage Contribution of Standard Deviations in a Distribution. Dive deeper with the Variance Distribution Analyzer or calculate custom impacts using the Standard Deviation Density Contribution Tool. See how SD ranks importance in the Standard Deviation Importance Score Calculator.
Conclusion
The sd percentage contribution calculator illuminates how variance distributes across SD bands in a normal distribution, with the center contributing most and tails adding amplified impact. This tool fosters deep understanding of spread vs frequency, clarifying why variance interpretation differs from probability.
Empirical Rule Calculator
Explore our statistical tools: calculate percentiles, visualize bell curves, and plot z-scores with simple, accurate calculators for normal distributions.
Try CalculatorEmpirical Rule Graph Generator
Visualize the 68-95-99.7 Rule with a bell curve showing standard deviation intervals. Great for quick insights and presentations.
Try CalculatorBell Curve Generator
Create customizable bell curve plots for any normal distribution. Perfect for data analysis and visual reports.
Standard Deviation Shading Calculator
Shade areas under the curve based on standard deviation. Instantly see data coverage between values.
Try Calculator