Bell Curve Grading Calculator
A bell curve grading calculator curves a score against the class mean and standard deviation. It converts the score to a z-score, rescales it to the target mean and spread, and gives the percentile and grade. A score of 85 with a mean of 70 and an SD of 10 curves to 90 — an A at the 93.32nd percentile.
Bell Curve Grading Calculator
Curve one score to its curved value and letter grade, or work out the raw-score cutoffs for a whole class.
Try:
| Grade | Share of class | Raw-score range |
|---|---|---|
| A | Top 10% | 82.8 and above |
| B | Next 20% | 75.2 to 82.8 |
| C | Middle 40% | 64.8 to 75.2 |
| D | Next 20% | 57.2 to 64.8 |
| F | Bottom 10% | Below 57.2 |
What Is Grading on a Curve?
Grading on a curve means assigning grades by how each score compares with the rest of the class, rather than by fixed percentage marks. The class average becomes the centre of the scale — usually a C — and scores spread out around it along the bell curve, so a fixed share of students earns each grade. A score well above the average can earn an A even when it is not 90%, while a score below the average can fail even when it is above 60%.
Teachers usually reach for this method when a test turns out harder than planned, or when they want grades to show relative performance instead of raw marks. It only works fairly, though, when the scores are roughly bell-shaped: most students clustered near the middle, with fewer very high and very low scores. When scores follow a normal distribution, the curve gives a predictable spread — about 68% of scores fall within one standard deviation of the mean, as the empirical rule describes.
How to Grade on a Bell Curve
Grading on a bell curve takes four steps. First, work out the class mean and the standard deviation of the raw scores. Second, turn each raw score into a z-score with z = (score − mean) ÷ SD. Third, rescale each z-score to the target mean and standard deviation you want: curved score = z × target SD + target mean. Fourth, give the letter grade from the z-score bands in the table below.
Worked example. A class sits a test with a mean of 70 and a standard deviation of 10, and the teacher wants the curved scores centred on a mean of 75 with the same spread of 10. A student who scored 85 has a z-score of (85 − 70) ÷ 10 = +1.50. The curved score is +1.50 × 10 + 75 = 90, the percentile is 93.32, and because +1.50 sits above the +1.28 cutoff for the top 10%, the grade is an A. A student who scored 60 gets z = −1.00, a curved score of 65, the 15.87th percentile and a D — the same worked example the calculator above shows step by step.
You can run the same steps for any class with the calculator above: enter the raw score, class mean and standard deviation, then choose the target mean and standard deviation for the curved scores. The most common choice is to keep the spread the same and move the mean up to 75, which lifts the class average to a C+ without changing who sits above or below whom.
Bell Curve Grading Scale: Grade Bands
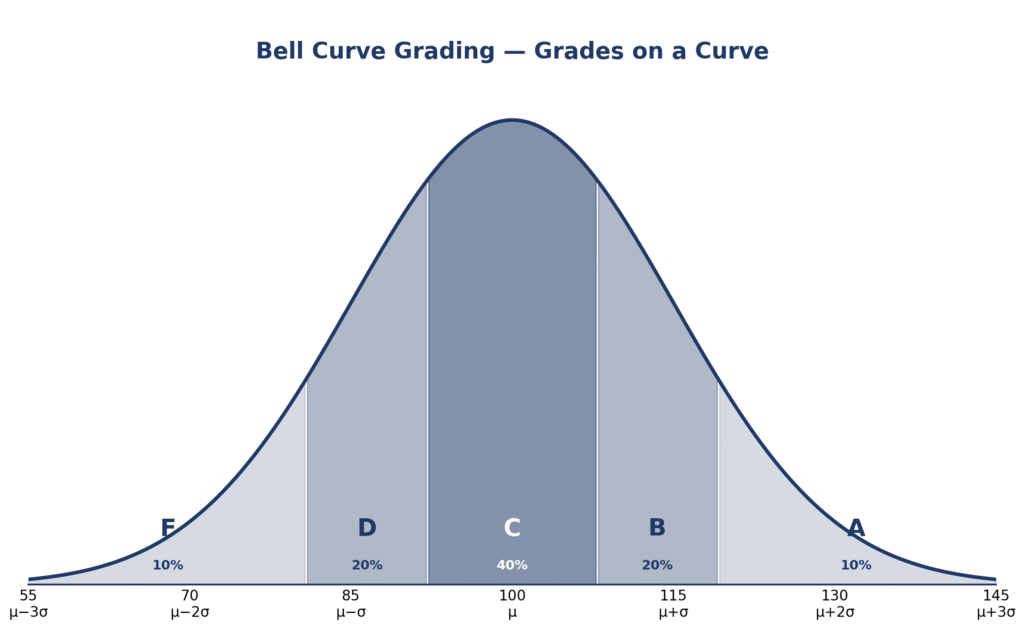
Most bell curve grading scales split a class into five bands with fixed shares: A for the top 10%, B for the next 20%, C for the middle 40%, D for the next 20% and F for the bottom 10%. The table shows the z-score cutoffs that produce those shares, and the raw-score cutoffs for a class with a mean of 70 and a standard deviation of 10 — the same numbers the Grade cutoffs mode of the calculator above produces.
| Grade | Share of class | Z-score range | Raw-score range (mean 70, SD 10) |
|---|---|---|---|
| A | Top 10% | z ≥ +1.28 | 82.8 and above |
| B | Next 20% | +0.52 to +1.28 | 75.2 to 82.8 |
| C | Middle 40% | −0.52 to +0.52 | 64.8 to 75.2 |
| D | Next 20% | −1.28 to −0.52 | 57.2 to 64.8 |
| F | Bottom 10% | z < −1.28 | Below 57.2 |
Why these cutoffs? A z-score of +1.28 marks the 90th percentile of the normal distribution, so 10% of scores sit above it. A z-score of +0.52 marks the 70th percentile and −0.52 marks the 30th percentile, which leaves the middle 40% for a C. The same three numbers give the cutoffs for any class: add the z-score times the standard deviation to the class mean. To see how a z-score turns into a percentile, use the normal distribution tool, and for the difference between a percentile and a probability, read our guide to percentile vs probability.
When Curving Helps and When It Hurts
Curving helps most when a test was harder than the teacher intended. If the class average is 52, a curve that recentres the mean on 75 gives every student a mark that reflects what they knew relative to their classmates, instead of a mark that reflects a badly set paper. It also helps when two sections of the same course sat different papers, because each section is graded against its own average.
Curving hurts when the class is small. In a class of 12, the top 10% is a single student, so one mark can decide the only A — and the margin of error on such a tiny group is large. It also hurts when scores are already high: if the class mean is 82, curving to a mean of 75 would lower good marks and punish students for doing well. And it hurts when scores are not bell-shaped at all — for example, when half the class aced a topic and half missed it, the two humps do not fit one curve, and the bands mislabel both groups.
A good rule: curve to lift marks, not to lower them, and never curve a class of fewer than about 25 students.
Is Grading on a Curve Fair?
Grading on a curve is fair when it corrects a test that was too hard, because it judges students against each other instead of against an arbitrary pass mark. It becomes unfair when it forces a fixed share of students to fail even though everyone learned the material, or when students end up competing for a limited number of A grades instead of learning together.
Fairness also depends on honesty: students should know before the test that grades will be curved, and by how much. The fairest version curves scores up only — nobody’s mark goes down — and pairs the curve with clear cutoffs published in advance, so everyone can aim for the A band instead of guessing where it sits.
The Z-Score Connection: Curving Is Z-Score Rescaling
Under the hood, grading on a curve is simply z-score rescaling. A z-score measures how many standard deviations a score sits from the mean: z = (score − mean) ÷ SD. The curved score is the same z-score written on a new scale: curved = z × target SD + target mean. Because every student’s z-score stays the same, the order of the class never changes — curving only moves and stretches the scale, which is why a student at the 93.32nd percentile stays at the 93.32nd percentile whatever the new mean and spread are.
To explore the conversion itself, try our z-score calculator, and to see how scores spread around a mean, use the normal distribution calculator. The standard reference for the normal distribution and z-scores used here is the NIST/SEMATECH e-Handbook of Statistical Methods.
Frequently Asked Questions
How do I grade on a bell curve?
Work out the class mean and standard deviation, turn each score into a z-score, rescale each z-score to your target mean and spread, then give the letter grade from the bands. The calculator above does all four steps and shows the working for every result.
How do I curve a test score?
Use curved score = z × target SD + target mean, where z = (score − class mean) ÷ class SD. For example, a score of 85 with a class mean of 70 and an SD of 10 gives z = +1.50, and with a target mean of 75 and a target SD of 10 the curved score is 90.
What is grading on a curve?
Grading on a curve means assigning grades by a student’s position in the class instead of by fixed percentage marks. The class average becomes the centre of the scale and a fixed share of students earns each grade: 10% A, 20% B, 40% C, 20% D and 10% F.
What are the bell curve grading scale percentages?
The standard split is A 10%, B 20%, C 40%, D 20% and F 10%. These shares come from the z-score cutoffs +1.28, +0.52, −0.52 and −1.28, which mark the 90th, 70th, 30th and 10th percentiles of the normal distribution.
How do I calculate curved grades?
Find the class mean and standard deviation, convert every score to a z-score, then rescale with curved = z × target SD + target mean. To grade a whole class at once, use the Grade cutoffs mode above: it gives the raw-score cutoffs for A, B, C, D and F for your class mean and standard deviation.
Is grading on a curve fair?
It is fair when it corrects a test that was too hard, because it judges students against each other instead of an arbitrary pass mark. It is unfair when it forces a fixed share of students to fail even though everyone learned the material. Curving scores up only, and announcing the curve in advance, makes it fairer.
What z-score do I need for an A on a bell curve?
You need a z-score of +1.28 or higher, which puts you in the top 10% of the class. With a class mean of 70 and a standard deviation of 10, that means a raw score of 82.8 or more.
Can a curved grade go down?
Yes. If your raw score is below the class mean, or the target mean is lower than the class mean, your curved score can be lower than your raw score. Most teachers curve up only, so check the policy before applying a curve.
Curving one score at a time is only the start: use the bell curve generator to draw the whole distribution for your class, or browse our free statistics tools — including the IQ bell curve calculator — for more ways to explore the normal curve.
More Tools to Explore
Z-Score Calculator
Turn any value into a z-score and find its percentile and probability on the bell curve.
Try CalculatorIQ Bell Curve Calculator
Convert an IQ score into a z-score, percentile and rarity on the bell curve.
Try CalculatorNormal Distribution Calculator
Find probabilities, percentiles and critical values for any normal distribution.
Try CalculatorStandard Deviation Calculator
Work out the mean, variance and standard deviation of any data set in seconds.
Try CalculatorPercentile vs. Probability: What’s the Difference?
Learn how percentiles and probabilities differ — and when to use each one.
Read ArticleExplore All Statistical Tools
Browse all 29 free statistics tools in one place — no sign-up, instant results.
Browse All Tools