Margin of Error Calculator
A margin of error calculator finds how far a sample result may sit from the true population value. At 95% confidence, with a standard deviation of 15 and a sample of 100, the margin of error is 2.94, so a sample mean of 100 gives the confidence interval 97.06 to 102.94. Try it below — every step is shown.
Margin of Error Calculator
Find the margin of error and the confidence interval for a mean or a proportion — or work out the sample size you need.
Try:
Try:
Try:
Chart library is still loading. Your results above are already calculated.
What is the margin of error?
The margin of error is the radius of uncertainty around a sample result. If a poll finds that 52% of voters favour a candidate, and the margin of error is 3.10%, the true value most likely lies between 48.90% and 55.10% — the estimate, plus or minus the margin of error. The smaller the margin of error, the more precise the estimate.
For a sample mean, use the margin of error formula:
MoE = z* × σ ÷ √n
Here, z* is the critical value for your confidence level, σ is the standard deviation, and n is the sample size. The part σ ÷ √n is the standard error, so the margin of error is simply the critical value multiplied by the standard error. If you need σ first, our standard deviation calculator will work it out from your data.
For a sample proportion, the margin of error formula is:
MoE = z* × √(p(1 − p) ÷ n)
Here, p is the sample proportion and n is the sample size. The margin of error is at its largest when p = 0.5, which is why pollsters often plan for the worst case of 50%.
The critical values you need are in the table below. You can also find them with our z-score calculator, and our normal distribution calculator shows the areas under the standard normal curve behind them. The most common choice is 95% confidence, where z* = 1.96 — the z-score for 95% confidence.
| Confidence level | Critical value (z*) |
|---|---|
| 90% | 1.645 |
| 95% | 1.96 |
| 99% | 2.58 |
How to calculate margin of error
Calculating a margin of error takes three steps: pick a confidence level and its z* value, work out the standard error, and multiply the two. The calculator above does the arithmetic, but it helps to see a worked example.
Example 1 — a mean. A sample of 100 exam scores has a standard deviation of 15. At 95% confidence, z* = 1.96. The standard error is 15 ÷ √100 = 15 ÷ 10 = 1.50, so the margin of error is 1.96 × 1.50 = 2.94. If the sample mean is 100, the 95% confidence interval is 100 ± 2.94, or 97.06 to 102.94.
Example 2 — a bigger sample. Keep the same standard deviation of 15 but take 400 people instead of 100. The standard error is 15 ÷ √400 = 15 ÷ 20 = 0.75, so the margin of error is 1.96 × 0.75 = 1.47 — half the 2.94 from the first example. Quadrupling the sample size halves the margin of error.
Example 3 — a proportion. In a survey of 1,000 people, 50% say yes. At 95% confidence, the standard error is √(0.5 × 0.5 ÷ 1000) = √0.00025 = 0.0158, so the margin of error is 1.96 × 0.0158 = 0.0310, or 3.10%. The 95% confidence interval is 50% ± 3.10%, or 46.90% to 53.10%.
Example 4 — a sample size. To keep the margin of error at or below 2 with a standard deviation of 15 at 95% confidence, solve n = (z* × σ ÷ E)² = (1.96 × 15 ÷ 2)² = (14.70)² = 216.09, then round up to the next whole person: n = 217. Use the Sample size mode of the calculator above, or read the interval directly from a mean and a standard deviation with our confidence interval from a mean and standard deviation calculator.
Compare the 99% case: with a standard deviation of 20 and a sample of 100, the margin of error at 99% confidence is 2.58 × (20 ÷ √100) = 2.58 × 2 = 5.16 — much wider than the same calculation at 95%.
As a rough cross-check, the empirical rule says about 95% of values in a normal distribution fall within two standard deviations of the mean. That is a statement about the data itself, not about sampling error — see our guide to the empirical rule vs confidence interval for the distinction.
Margin of error vs confidence interval
The margin of error and the confidence interval are two halves of the same result. The margin of error is the radius; the confidence interval is the estimate, plus or minus that radius. If your sample mean is 100 and the margin of error is 2.94, the 95% confidence interval is 100 ± 2.94, or 97.06 to 102.94. Reporting one without the other leaves the reader guessing, so our confidence interval calculator gives you both at once.
What changes the margin of error
Three things move the margin of error. First, sample size: a bigger sample gives a smaller margin of error, because the standard error σ ÷ √n shrinks as n grows. With a standard deviation of 15 at 95% confidence, the margin of error is 5.88 with n = 25, 2.94 with n = 100, and 1.47 with n = 400 — quadrupling the sample halves it.
Second, confidence level: a higher confidence level gives a LARGER margin of error, not a smaller one. Asking for more confidence means casting a wider net — the critical value grows from 1.645 at 90% to 1.96 at 95% to 2.58 at 99%, and the margin of error grows with it. This is the most common misunderstanding in the subject, so it is worth stating plainly: more confidence means a bigger margin of error.
Third, variability: a larger standard deviation means a larger margin of error, and for proportions the margin of error peaks at p = 0.5. The only way to cut a large margin of error without relaxing the confidence level is to take a bigger sample.
What does a 95% confidence interval mean?
A 95% confidence interval does NOT mean that 95% of the data falls inside it. That is the most common misconception in this subject, and it is wrong: the interval is about the population mean or proportion, not about individual values. What a 95% interval does mean is this: repeat the same sampling procedure 100 times and build an interval each time, and about 95 of those 100 intervals will contain the true value. Any single interval either contains it or does not — the 95% describes the procedure, not that one interval.
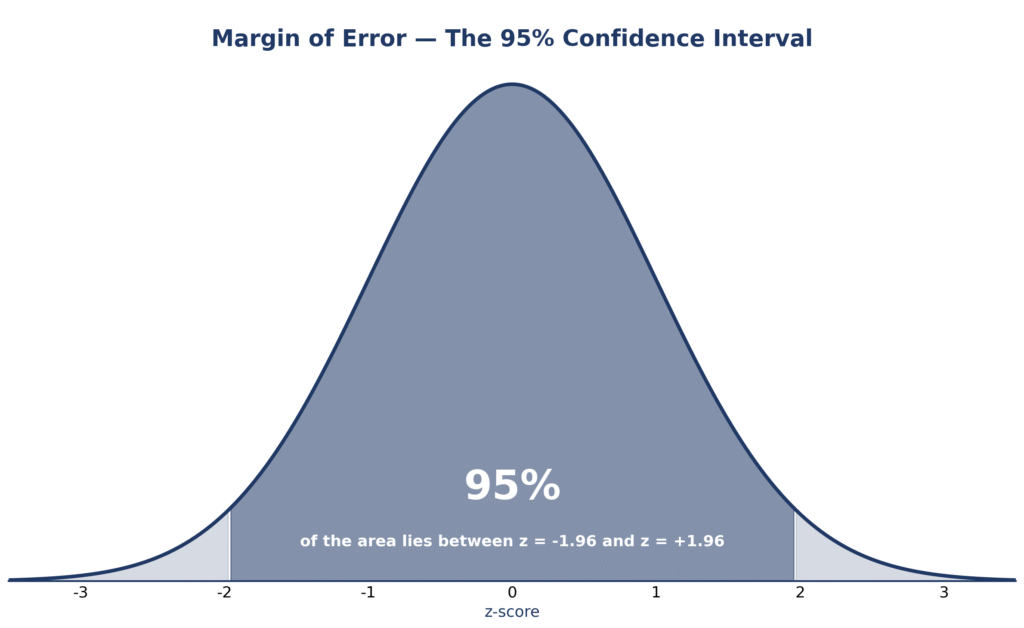
It helps to picture it: the diagram above shows the standard normal curve with the middle 95% shaded between z = −1.96 and z = +1.96, which is exactly where the 95% critical value comes from. You can build a similar picture for any data with our bell curve generator, or see it applied to scores with the IQ bell curve calculator. The NIST/SEMATECH e-Handbook of Statistical Methods gives the same careful definition of confidence intervals.
Frequently asked questions
How do I calculate the margin of error?
Choose a confidence level and its critical value (z* = 1.96 for 95%), work out the standard error (σ ÷ √n for a mean, or √(p(1 − p) ÷ n) for a proportion), and multiply the two. For example, with a standard deviation of 15 and a sample of 100 at 95% confidence, the margin of error is 1.96 × 1.50 = 2.94. The calculator at the top of this page shows every step.
What is the margin of error formula with standard deviation?
For a mean, the margin of error formula with standard deviation is MoE = z* × σ ÷ √n, where σ is the standard deviation and n is the sample size. Divide the standard deviation by the square root of the sample size to get the standard error, then multiply by the critical value for your confidence level.
What is a good margin of error?
There is no single “good” value — it depends on the decision the number supports. National polls usually aim for about ±3%, which at 95% confidence needs roughly 1,000 respondents. For most surveys, a margin of error between 3% and 5% is considered usable, while anything above 10% is usually too vague to act on. Smaller is always better, but it costs a larger sample.
What is the margin of error at 95% confidence?
At 95% confidence the critical value is z* = 1.96, so the margin of error is 1.96 times the standard error. With a standard deviation of 15 and a sample of 100, that is 1.96 × 1.50 = 2.94. The same standard error at 90% confidence would give 1.645 × 1.50 = 2.47, and at 99% it would give 2.58 × 1.50 = 3.87.
How do I find the sample size for a margin of error?
Rearrange the formula to n = (z* × σ ÷ E)², where E is the margin of error you want, and always round up to the next whole person. For a margin of error of 2 with a standard deviation of 15 at 95% confidence, n = (1.96 × 15 ÷ 2)² = 216.09, rounded up to 217 people. The Sample size mode of the calculator above does this for you.
Does higher confidence increase margin of error?
Yes. A higher confidence level uses a larger critical value, so it produces a larger margin of error. At 90% confidence z* = 1.645, at 95% it is 1.96, and at 99% it is 2.58 — so the same sample gives a wider interval when you demand more confidence. If you want a smaller margin of error, take a bigger sample instead of lowering the confidence level.
What is the difference between margin of error and confidence interval?
The margin of error is the radius, and the confidence interval is the estimate plus or minus that radius. With a sample mean of 100 and a margin of error of 2.94, the 95% confidence interval is 97.06 to 102.94. Report both: the point estimate and the interval around it.
Can the margin of error be negative?
No. The margin of error is a distance — the size of the radius around your estimate — so it is always zero or positive. A negative value would mean an arithmetic mistake, usually a sign error in the standard error or a sample size entered as a negative number.
Use the margin of error calculator above whenever you need a margin of error for a mean, a proportion, or a sample size — and if you want more statistics tools, browse all of our free statistics tools.
More Tools to Explore
Empirical Rule Confidence Interval Calculator
Estimate data ranges using the 68-95-99.7 rule. Enter mean and SD to get ±1σ, ±2σ, or ±3σ intervals.
Try CalculatorConfidence Interval from Mean and Standard Deviation Calculator
Compute exact confidence intervals from sample data. Input mean, SD, and sample size for 90%, 95%, or 99% confidence.
Try CalculatorZ-Score Calculator
Turn any value into a z-score and find its percentile and probability on the bell curve.
Try CalculatorNormal Distribution Calculator
Find probabilities, percentiles and critical values for any normal distribution.
Try CalculatorStandard Deviation Calculator
Work out the mean, variance and standard deviation of any data set in seconds.
Try CalculatorExplore All Statistical Tools
Browse all 29 free statistics tools in one place — no sign-up, instant results.
Browse All Tools