What is a z-score?
A z-score, also called a standard score, is the number of standard deviations a value lies from the mean of its distribution. A z-score of 0 means the value equals the mean, a positive z-score means it is above the mean, and a negative z-score means it is below it. Because z-scores are unit-free, they let you compare scores from different tests, scales or groups — for example, an exam mark and an IQ score — on the same scale.
The z-score formula is z = (x − μ) ÷ σ, where x is the value, μ is the mean and σ is the standard deviation. Once you have z, the standard normal distribution turns it into a percentile: the share of values below it. That is why the same tool can report a z-score, a percentile and tail probabilities together, as the z score calculator above does.
How to calculate a z-score
Calculating a z-score takes four steps. The worked example uses the IQ scale, where the mean is 100 and the standard deviation is 15 — an IQ of 130 is the classic case.
- Write down the value, the mean and the standard deviation. For the example, x = 130, μ = 100 and σ = 15.
- Subtract the mean from the value. 130 − 100 = 30. This is how far the score sits above the mean in the original units.
- Divide by the standard deviation. 30 ÷ 15 = 2, so z = +2.00.
- Read the percentile from the standard normal distribution. Φ(2.00) = 0.9772, so 130 is at the 97.72nd percentile — higher than about 97.72% of the population.
Two more checks on the same scale: a score of 85 gives z = (85 − 100) ÷ 15 = −1.00, the 15.87th percentile, and a score of 100 gives z = 0, exactly the 50th percentile, because it equals the mean. Try both with the “Score 85” and “Score 100” buttons above, or see the same IQ figures on the IQ bell curve calculator.
Z-score interpretation table
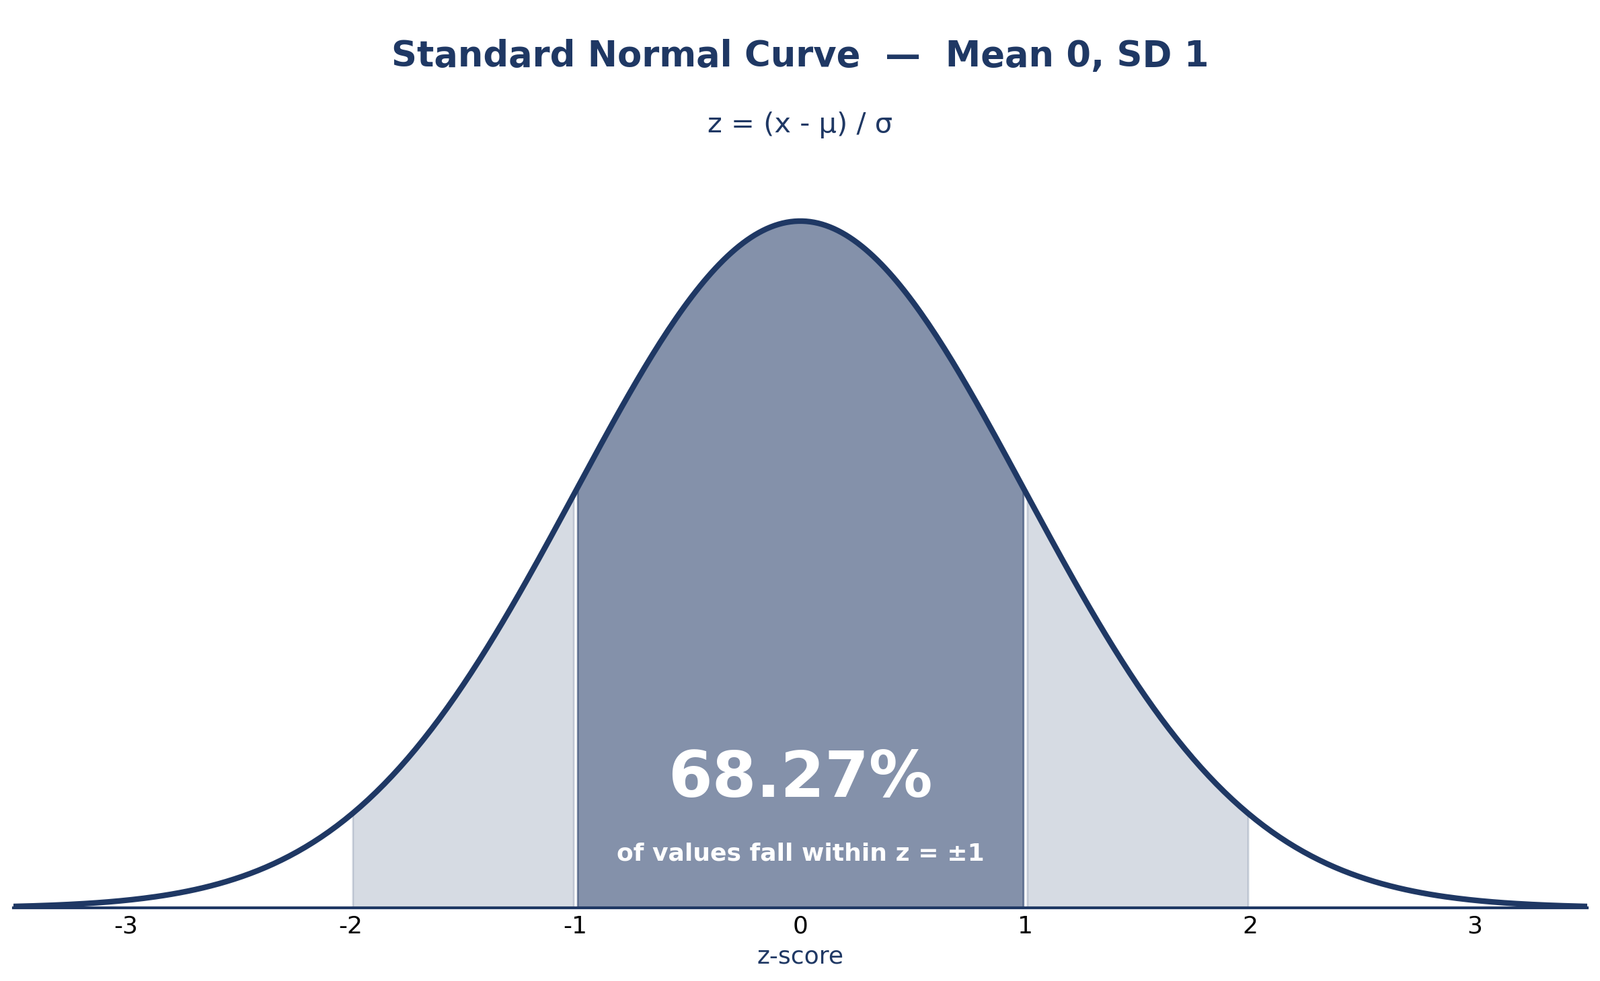
The sign of a z-score tells you the direction, and its size tells you how unusual the value is. About 68.27% of values fall within one standard deviation of the mean, 95.45% within two, and 99.73% within three — the 68-95-99.7 rule, which is what the empirical rule says about normal distributions.
| z-score | Percentile | What it means |
|---|---|---|
| −2 | 2.28th | Well below average; only about 2.28% of values are lower. |
| −1 | 15.87th | Below average; about 15.87% of values are lower. |
| 0 | 50th | Exactly average; half of values are lower and half are higher. |
| +1 | 84.13th | Above average; about 84.13% of values are lower. |
| +2 | 97.72nd | Well above average; about 97.72% of values are lower. |
Percentiles come from the standard normal cumulative distribution Φ(z). The 68.27% band is shown in the diagram below, where the standard normal curve has mean 0 and standard deviation 1.
If you want to see a value plotted on the curve rather than as a number, the z-score graph plotter draws it for you, and the bell curve generator builds a whole curve for any mean and standard deviation.
How to find a z-score from a percentile
To find a z-score from a percentile, invert the standard normal distribution: z = Φ−1(percentile ÷ 100). For the 90th percentile, z ≈ +1.28. Then convert back to the original scale with x = μ + zσ. With a mean of 100 and a standard deviation of 15, that gives x = 100 + 1.28 × 15 = 119.2, so about 119.2 marks the 90th percentile on that scale.
The reverse direction is how cut-offs are set: if a programme admits the top 10%, it admits scores above the 90th percentile. Use the Reverse tab above for any percentile; it shows both the z-score and the value, with the steps. The same idea in reverse — from a percentile to a value — is what the empirical rule percentile calculator does for the 68–95–99.7 bands.
Z-score in Excel
In Excel or Google Sheets, the fastest route is =STANDARDIZE(x, mean, standard_dev). For the worked example, =STANDARDIZE(130, 100, 15) returns 2. It is the same formula as above, with the same caution: use the population standard deviation, not a sample one, unless your data call for it.
For percentiles and reverse lookups, use =NORM.S.DIST(z, TRUE) for Φ(z) and =NORM.S.INV(percentile) for the inverse. For example, =NORM.S.DIST(2, TRUE) returns 0.9772, the same 97.72nd percentile, and =NORM.S.INV(0.9) returns 1.2816, the z-score for the 90th percentile. In Google Sheets the same three functions work; older workbooks may use NORMSDIST and NORMSINV instead.
Sample vs population standard deviation
Which standard deviation you divide by changes the z-score, so it matters. A population standard deviation divides the squared deviations by n; a sample standard deviation divides by n − 1, which makes it slightly larger. Use the population version when you have the whole group, and the sample version when your numbers are a sample drawn from a larger group.
The Dataset tab above computes both. For 10, 20, 30, 40, 50, the mean is 30, the sample standard deviation is 15.81 and the population standard deviation is 14.14. For the value 40, that gives z = (40 − 30) ÷ 15.81 = +0.63 with the sample standard deviation, or +0.71 with the population one — the same value, two slightly different standard scores, so always say which one you used. To see how the two spreads shade the curve differently, try the standard deviation shading tool.
What does a z-score of 2 mean?
A z-score of 2 means the value is two standard deviations above the mean. In a normal distribution only about 2.28% of values lie above it, so it sits at the 97.72nd percentile — higher than roughly 98 in every 100 values. On the IQ scale that is a score of 130; on an exam with a mean of 70 and a standard deviation of 10 it would be a mark of 90.
A z-score of −2 is the mirror image: two standard deviations below the mean, the 2.28th percentile. Z-scores beyond ±3 are rare — about 0.27% of values fall outside that range — and a z-score above 4 is rarer still, which is why very high or very low z-scores are worth double-checking for data errors before trusting them. A percentile and a probability describe the same area in different words: the percentile is the share below the value, while a tail probability is the share beyond it. If the two get mixed up, the difference between percentile and probability clears it up.
Z-score to percentile and the z-table
The calculator converts a z-score to a percentile for you, but a printed z-table does the same job: find the row for your z-score and read off the area to its left. The table below covers the reference points most people look up; for any other value, use the z-score to percentile converter for the full conversion.
| z | Φ(z) | Percentile |
|---|---|---|
| 0.00 | 0.5000 | 50.00th |
| 0.50 | 0.6915 | 69.15th |
| 1.00 | 0.8413 | 84.13th |
| 1.28 | 0.8997 | 89.97th |
| 1.645 | 0.9500 | 95.00th |
| 1.96 | 0.9750 | 97.50th |
| 2.00 | 0.9772 | 97.72nd |
| 2.33 | 0.9901 | 99.01st |
| 2.58 | 0.9951 | 99.51st |
| 3.00 | 0.9987 | 99.87th |
Those reference points are also the critical values used in confidence intervals — 1.96 for 95% and 2.58 for 99% — which is why they appear in so many textbooks. The NIST/SEMATECH e-Handbook of Statistical Methods gives the standard normal distribution and its tables in full, and it is the reference used for the figures on this page.
Frequently asked questions
How do I calculate a z-score?
Use z = (x − μ) ÷ σ: subtract the mean from the value, then divide by the standard deviation. For example, (130 − 100) ÷ 15 = +2.00. The calculator above shows every step, including the percentile and the tail probabilities.
What is a z-score?
A z-score is a standard score that states how many standard deviations a value is from the mean. A z-score of 0 is exactly average, a positive z-score is above the mean and a negative z-score is below it. It lets you compare values from different distributions on one scale.
What is the z-score of 130 with a mean of 100 and a standard deviation of 15?
It is +2.00. The calculation is (130 − 100) ÷ 15 = 30 ÷ 15 = 2, and Φ(2.00) = 0.9772, so an IQ of 130 is at the 97.72nd percentile.
How do I find a z-score from a percentile?
Invert the standard normal distribution: z = Φ−1(percentile ÷ 100). The 90th percentile gives z ≈ +1.28, the 95th gives z ≈ +1.64 and the 99th gives z ≈ +2.33. Then x = μ + zσ turns it back into a value on your scale. The Reverse tab above does both steps for you.
How do I calculate a z-score in Excel?
Use =STANDARDIZE(x, mean, standard_dev). For example, =STANDARDIZE(130, 100, 15) returns 2. Use =NORM.S.DIST(z, TRUE) for the percentile and =NORM.S.INV(percentile) for the reverse direction.
What does a z-score of 2 mean?
It means the value is two standard deviations above the mean — the 97.72nd percentile in a normal distribution. Only about 2.28% of values are higher. On the IQ scale (mean 100, standard deviation 15) that is a score of 130.
Can a z-score be negative?
Yes. A negative z-score means the value is below the mean: a score of 85 with a mean of 100 and a standard deviation of 15 has z = −1.00. Z-scores can also be larger than 3 or smaller than −3, but such values are rare in a normal distribution.
Is a z-score the same as a percentile?
No. A z-score is a distance from the mean measured in standard deviations; a percentile is the share of values below it. The two are linked by the standard normal distribution — a z-score of +1.00 is the 84.13th percentile — but they are different numbers answering different questions.
For more normal-distribution tools, browse all the calculator tools on this site.