How to calculate normal distribution probability
To calculate normal distribution probability, convert your value to a z-score with z = (x − μ) / σ, then find the standard normal cumulative probability, Φ(z). A normal distribution probability calculator does this in one step, using the exact cumulative distribution function (CDF) instead of a printed z-table. This tool is also a normal CDF calculator and a normal distribution graph generator: it returns the probability, the z-score and a shaded curve for every calculation.
The method has three steps. First, find how far x is from the mean in standard deviations: z = (x − μ) / σ. Second, find Φ(z), the area under the standard normal curve to the left of z. Third, adjust that area for the question you are asking: use Φ(z) for P(X < x), 1 − Φ(z) for P(X > x), and the difference of two CDF values for an interval. If you only need the z-score itself, use our z-score calculator, and if you want to draw the curve first, try our bell curve generator or plot the result on a z-score graph.
How do you find the probability between two values in a normal distribution?
To find the probability between two values in a normal distribution, work out the CDF at each end of the interval and subtract: P(a < X < b) = Φ(zb) − Φ(za), where za = (a − μ) / σ and zb = (b − μ) / σ. Choose the “between” mode above and enter a and b, and the calculator shows both z-scores and the subtraction. Remember that a percentile and a probability are not the same thing: a probability is the area of an interval, while a percentile is the value below which a given percentage falls — see the difference between a percentile and a probability.
For example, with mean 100 and standard deviation 15, the probability between 85 and 115 is 0.6827, or 68.27%. That is because z = −1.00 at 85 and z = +1.00 at 115, and Φ(1.00) − Φ(−1.00) = 0.8413 − 0.1587 = 0.6827.
What is the inverse normal distribution?
An inverse normal distribution calculation works backwards: instead of starting from a value and finding its probability, you start from a probability p and find the value x that has that cumulative probability. An inverse normal calculator finds z = Φ−1(p) and then converts it back with x = μ + σz. With mean 100, standard deviation 15 and p = 0.90, z = 1.28 and x = 119.22, so 90% of values fall below 119.22.
Worked examples
Example 1: IQ score of 130
IQ scores are normally distributed with mean 100 and standard deviation 15. For the IQ bell curve calculator the question is: what proportion of people score above 130? First, z = (130 − 100) / 15 = 2.00. Then Φ(2.00) = 0.9772, so P(X > 130) = 1 − 0.9772 = 0.0228, or 2.28%. About 2.28% of people score above 130, and 97.72% score below it.
Example 2: a score between two values
Suppose exam scores are normally distributed with mean 70 and standard deviation 10. What is the probability that a student scores between 60 and 80? The z-scores are z = (60 − 70) / 10 = −1.00 and z = (80 − 70) / 10 = +1.00. So P(60 < X < 80) = Φ(1.00) − Φ(−1.00) = 0.8413 − 0.1587 = 0.6827, or 68.27%. The same result holds for any interval that is one standard deviation either side of the mean.
Example 3: the 90th percentile, worked backwards
What IQ score marks the 90th percentile? This is an inverse question: p = 0.90, so z = Φ−1(0.90) = 1.28, and x = 100 + 15 × 1.28 = 119.22. A score of about 119 is the 90th percentile. The 50th percentile is simpler: p = 0.50 gives z = 0, so x = 100, the mean itself.
Normal distribution vs the empirical rule
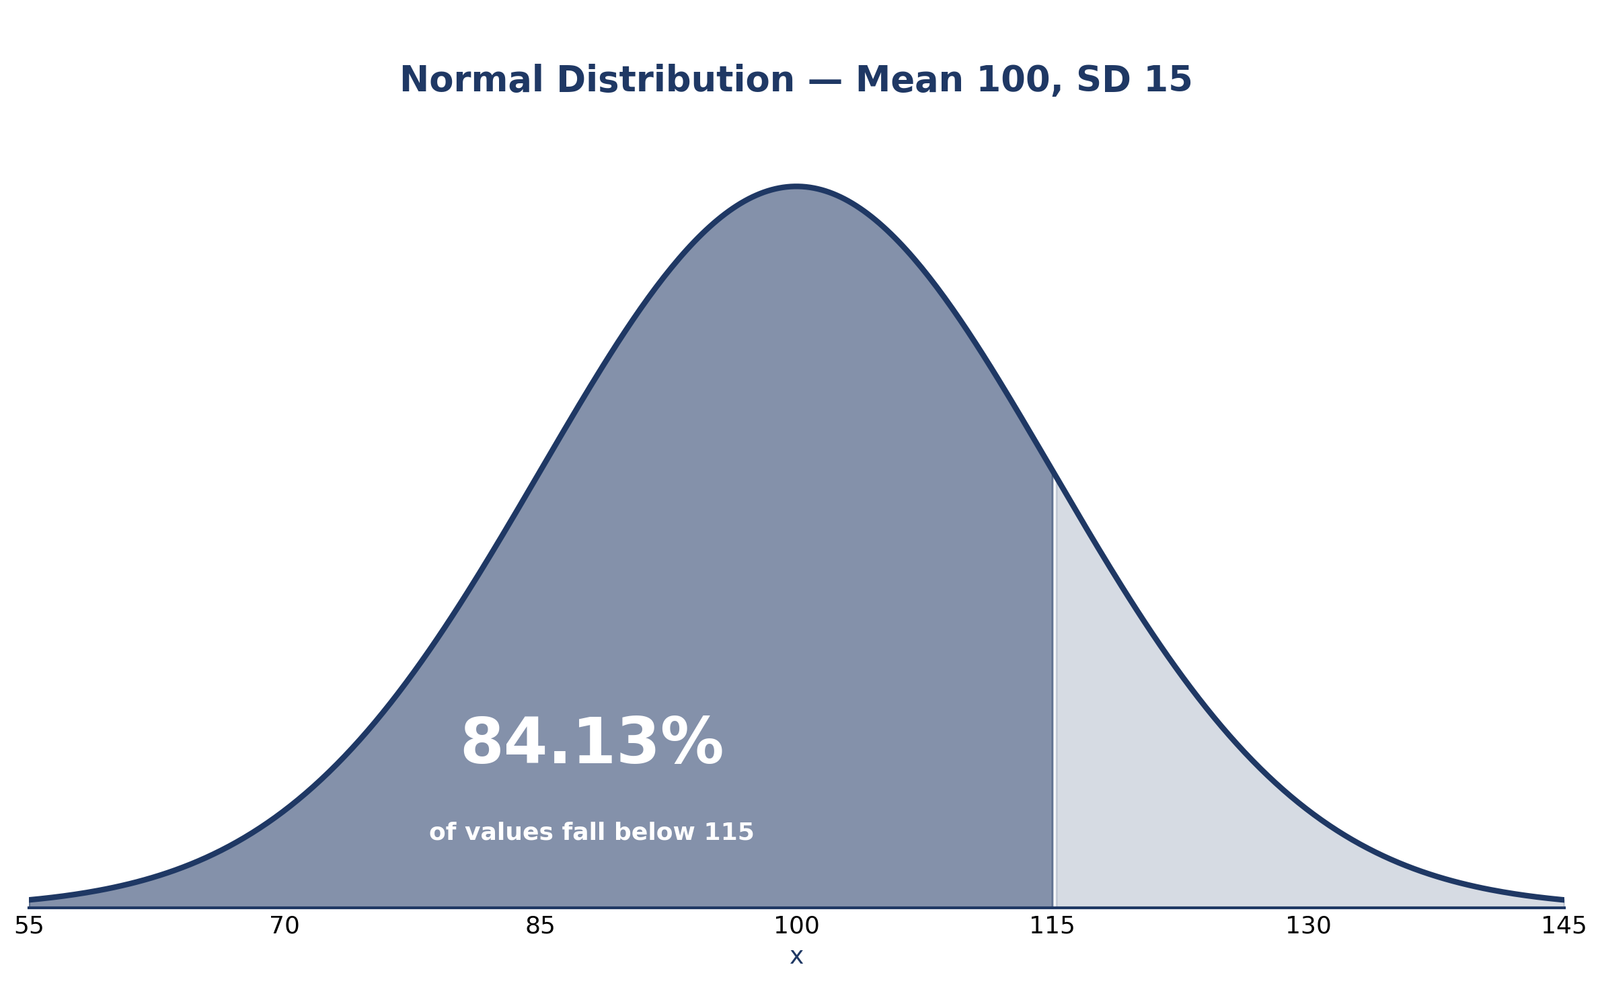
What the empirical rule is: about 68% of values lie within one standard deviation of the mean, about 95% within two, and about 99.7% within three. That is a useful quick check, but it only answers questions at whole standard deviations. The exact CDF answers any value, anywhere on the curve. For example, the empirical rule tells you that roughly 84% of values fall below one standard deviation above the mean; the exact calculation gives 84.13% for a mean of 100 and standard deviation of 15. Use the empirical rule for a fast estimate, and use this calculator when the number itself matters — in homework, in a report, or when a cut-off is not a whole number of standard deviations away. For the full background, see normal distribution and the empirical rule, shade the bands with our standard deviation shading tool, or convert a percentile with the empirical rule percentile calculator.
Critical values for the normal distribution
Critical values are the z-scores that mark the usual confidence levels. They are the inverse-normal answers for p = 0.95, 0.975 and 0.995, and they are worth memorising.
| z value | P(Z < z) | Two-sided confidence level |
|---|---|---|
| 1.645 | 0.9500 | 90% |
| 1.96 | 0.9750 | 95% |
| 2.58 | 0.9951 | 99% |
So a 95% confidence interval for a normal mean is μ ± 1.96σ, and a 99% interval is μ ± 2.58σ. To check any of these, set the calculator to the standard normal distribution (mean 0, standard deviation 1) and enter the z value: P(Z < 1.96) = 0.9750.
What does a normal distribution look like?
The curve below is a normal distribution with mean 100 and standard deviation 15, with the area below 115 shaded. That shaded area is 84.13% of the total, which is exactly the probability P(X < 115) = 0.8413 from the calculator. The curve is symmetric about the mean, rises to its peak at 100, and flattens towards zero in both tails. Because the calculator draws the curve for any mean and standard deviation you enter, it also works as a normal distribution curve generator.
A normal distribution is also called a Gaussian distribution, after Carl Friedrich Gauss, so a Gaussian distribution calculator is the same tool under a different name. Both names describe the same bell-shaped distribution, defined entirely by its mean, which sets its centre, and its standard deviation, which sets its width.