
How to calculate standard deviation: find the mean, subtract the mean from each value and square each result, add the squared deviations, then divide by N for a population (or by n − 1 for a sample) and take the square root.
In four steps: (1) find the mean, (2) subtract the mean and square, (3) add the squared deviations, (4) divide and take the square root. This guide works both formulas step by step with two fully worked examples, so you can check your work with our standard deviation calculator when you are done.
Standard deviation is the most common way to describe how spread out a set of numbers is. A small standard deviation means the values cluster tightly around the mean; a large one means they are spread far apart. Because it is measured in the same units as the data — dollars, points, years — it is easier to interpret than the variance, which is measured in squared units. In this guide you will learn how to calculate standard deviation step by step, when to use the population formula and when to use the sample formula, and how to check your answer in Excel or with a calculator.
What Is Standard Deviation?
Standard deviation is the average distance of the values in a data set from their mean — more precisely, it is the square root of the average squared distance from the mean. It answers the question "how far, typically, is a value from the average?" A data set of 147, 163, 129, 178 and 154 dollars has a mean of $154.20 and a sample standard deviation of $18.24, so a typical weekly grocery spend is about $18 away from the average. The same mean with a standard deviation of $50 would describe far less predictable spending.
Standard deviation is always zero or positive. It is zero only when every value is identical. It is written as σ (sigma) for a population and s for a sample, and it is the square root of the variance.
How to Calculate Standard Deviation Step by Step
Use the same six steps for any data set. The only decision is step 5: divide by N if you have the whole population, or by n − 1 if you have a sample.
- Find the mean of the data set: add all the values together and divide by how many values there are.
- Subtract the mean from each value to get the deviation of every value from the mean.
- Square each deviation so that negative and positive deviations do not cancel each other out.
- Add up all the squared deviations to get the sum of squared deviations.
- Divide the sum of squared deviations by N for a population, or by n − 1 for a sample, to get the variance.
- Take the square root of the variance. The result is the standard deviation.
Work through the grocery example below to see every step with real numbers, then try the practice problems at the end of this page.
Standard Deviation Formula with Example
There are two standard deviation formulas. They differ only in the final division: the population formula divides by N, the number of values in the whole population, while the sample formula divides by n − 1, the sample size minus one.
| Population standard deviation | Sample standard deviation |
|---|---|
| σ = √(Σ(x − μ)² / N) | s = √(Σ(x − x̄)² / (n − 1)) |
In these formulas, x is each value, μ (mu) is the population mean, x̄ (x-bar) is the sample mean, N is the size of the population, n is the size of the sample, and Σ means "add up". The n − 1 in the sample formula is called Bessel's correction: a sample tends to underestimate the spread of the population it came from, so dividing by a slightly smaller number corrects that bias.
Example: for the five grocery spends 147, 163, 129, 178 and 154, the mean is 154.20. The sum of squared deviations is 1330.80. As a sample, the variance is 1330.80 ÷ 4 = 332.70 and s = √332.70 = 18.24. As a population, the variance is 1330.80 ÷ 5 = 266.16 and σ = √266.16 = 16.31. The full table is in the worked example below.
How to Calculate Standard Deviation from Data
Here is the full worked example, one row at a time. A household recorded its weekly grocery spending, in dollars, for five weeks: $147, $163, $129, $178 and $154. Because these five weeks are a sample of all the household's weeks, the sample standard deviation is the right measure.
Step 1 — Find the mean. Add the values: 147 + 163 + 129 + 178 + 154 = 771. Divide by 5: 771 ÷ 5 = 154.20. The mean weekly spend is $154.20.
Steps 2 and 3 — Subtract the mean and square each deviation.
| Weekly spend ($) x | Deviation x − x̄ ($) | Squared deviation (x − x̄)² |
|---|---|---|
| 147 | −7.20 | 51.84 |
| 163 | +8.80 | 77.44 |
| 129 | −25.20 | 635.04 |
| 178 | +23.80 | 566.44 |
| 154 | −0.20 | 0.04 |
Notice that the deviations add to zero (−7.20 + 8.80 − 25.20 + 23.80 − 0.20 = 0), which is a useful check that the mean is right. Squaring stops the positives and negatives from cancelling out.
Step 4 — Add the squared deviations. 51.84 + 77.44 + 635.04 + 566.44 + 0.04 = 1330.80. This total is the sum of squared deviations, often written SS = 1330.80.
Step 5 — Divide to get the variance. For a sample, divide by n − 1 = 4: 1330.80 ÷ 4 = 332.70. (If these five weeks were the whole population, you would divide by N = 5 instead: 1330.80 ÷ 5 = 266.16.)
Step 6 — Take the square root. s = √332.70 = 18.24. The sample standard deviation is $18.24. For comparison, the population standard deviation of the same five numbers is σ = √266.16 = 16.31.
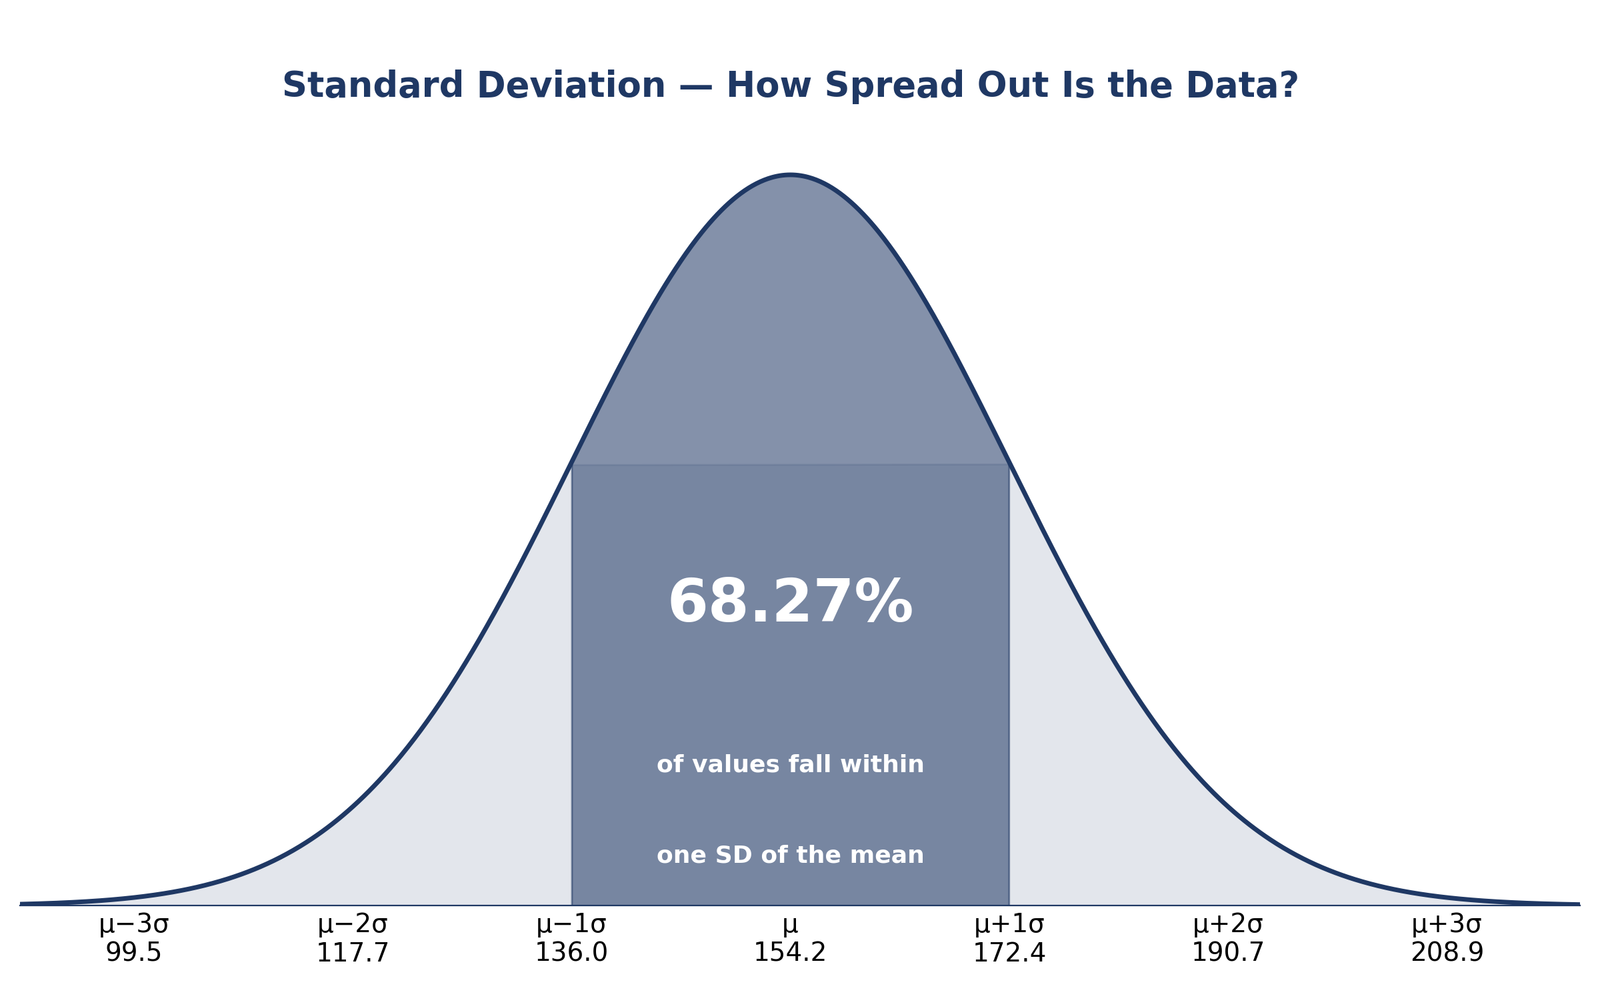
What the answer means: a typical week is about $18.24 away from the $154.20 average, and if spending followed a bell curve, about 68.27% of weeks would fall between $135.96 and $172.44 (one standard deviation either side of the mean). You can shade the ±1 SD band for any mean and standard deviation with the standard deviation shading tool, or draw the same curve with our bell curve generator.
Population vs Sample Standard Deviation
The population standard deviation (σ) describes a complete set of values — every student in a class, every week in a year. The sample standard deviation (s) describes part of a set — five weeks picked from a year of spending — and is used to estimate the population value. Use σ when you have every value; use s when you have a sample. In practice, most data you work with is a sample, so the sample formula is the one you will use most often.
| Feature | Population standard deviation (σ) | Sample standard deviation (s) |
|---|---|---|
| Data | The whole population | A sample from the population |
| Mean symbol | μ | x̄ |
| Divide by | N | n − 1 (Bessel's correction) |
| Formula | σ = √(Σ(x − μ)² / N) | s = √(Σ(x − x̄)² / (n − 1)) |
| Value for the grocery data | σ = 16.31 | s = 18.24 |
| When to use it | You have every value | You have a sample and want to estimate the population |
The sample value is always a little larger than the population value for the same numbers, because dividing by n − 1 instead of N inflates the variance slightly — that is the correction doing its job.
Standard Deviation Examples
Two more worked examples show the same six steps with different data, one treated as a population and one as a sample.
Example: Quiz Scores (Population)
Seven quiz scores are 4, 8, 6, 5, 3, 7 and 9. These are all the scores in the class, so this is a population.
Step 1 — Mean: 4 + 8 + 6 + 5 + 3 + 7 + 9 = 42; 42 ÷ 7 = 6. The mean is 6.
| Quiz score x | Deviation x − μ | Squared deviation (x − μ)² |
|---|---|---|
| 4 | −2 | 4 |
| 8 | +2 | 4 |
| 6 | 0 | 0 |
| 5 | −1 | 1 |
| 3 | −3 | 9 |
| 7 | +1 | 1 |
| 9 | +3 | 9 |
Steps 4–6: the sum of squared deviations is 4 + 4 + 0 + 1 + 9 + 1 + 9 = 28. The population variance is 28 ÷ 7 = 4.00, so σ = √4.00 = 2.00. If the same seven scores were treated as a sample, the variance would be 28 ÷ 6 = 4.67 and s = √4.67 = 2.16.
Example: Ages (Population)
Five ages are 34, 41, 29, 38 and 33 years. Mean: 34 + 41 + 29 + 38 + 33 = 175; 175 ÷ 5 = 35. Deviations: −1, +6, −6, +3, −2. Squared deviations: 1, 36, 36, 9, 4. Sum of squared deviations: 1 + 36 + 36 + 9 + 4 = 86. Population variance: 86 ÷ 5 = 17.20, so σ = √17.20 = 4.15. The typical age is about 4.15 years from the mean age of 35.
How Outliers Change the Standard Deviation
Standard deviation is sensitive to outliers, because squaring a large deviation makes it count for much more than a small one. Take the data set 4, 8, 15, 16, 23 and 42. The mean is 18, the sum of squared deviations is 910, the sample variance is 910 ÷ 5 = 182.00 and s = √182.00 = 13.49 (population σ = 12.31). Now remove the outlier, 42: the remaining values 4, 8, 15, 16 and 23 have a mean of 13.20 and a sample standard deviation of 7.40. Removing one value nearly halves the standard deviation, from 13.49 to 7.40 — so always check for outliers before trusting a standard deviation. Use our outlier threshold calculator to find the cut-off values for your own data.
Range Rule Standard Deviation Estimate
When you need a quick estimate and do not have the raw data, the range rule estimates the standard deviation as roughly one quarter of the range: SD ≈ range ÷ 4. It works because, for roughly bell-shaped data, almost all values fall within two standard deviations either side of the mean, so the full range spans about four standard deviations.
Example: test scores run from 52 to 96. The range is 96 − 52 = 44, so the estimated standard deviation is 44 ÷ 4 = 11. For the data set 10, 20, 30, 40 and 50, the range is 40, so the rule estimates SD ≈ 10 — but the true population standard deviation is 14.14, so here the rule underestimates the spread. Treat the range rule as a rough estimate only: it is handy for a sanity check, not a substitute for the real calculation. For small samples, statisticians sometimes use a refined version of the rule based on the sample size, proposed by Wan and colleagues in 2014.
Excel has a built-in function for each formula. Put your values in a column, for example A1:A5, and use:
- =STDEV.S(A1:A5) — the sample standard deviation (divides by n − 1).
- =STDEV.P(A1:A5) — the population standard deviation (divides by N).
For the values 10, 20, 30, 40 and 50, Excel gives =STDEV.P(...) = 14.14 and =STDEV.S(...) = 15.81. The older functions STDEV and STDEVP do the same jobs but are kept only for compatibility — use STDEV.S and STDEV.P in new work. On a TI-84 calculator, enter the data in a list, then press STAT, CALC, 1-Var Stats: Sx is the sample standard deviation and σx is the population standard deviation.
There is no single "good" standard deviation — it depends on what you are measuring. A standard deviation of $18.24 sounds large for weekly bus fares and small for monthly salaries. To judge a standard deviation, compare it with the mean using the coefficient of variation: CV = (standard deviation ÷ mean) × 100%. For the grocery data, CV = (18.24 ÷ 154.20) × 100% = 11.83%, which is fairly tight — weekly spending does not vary wildly. As a rough guide, a CV below about 15% means the data cluster closely around the mean, a CV between 15% and 30% is moderate, and a CV above about 30% means the data are highly spread out. Always judge a standard deviation in context, and compare it with the same measure in similar data, not with an absolute cut-off. To see how the total spread breaks down, try the SD percentage contribution calculator.
Variance vs Standard Deviation
Variance is the standard deviation squared: it is the average squared distance from the mean. The two measure the same spread, but the standard deviation is the one you report, because it is in the original units.
| Feature | Variance | Standard deviation |
|---|---|---|
| Symbol (population / sample) | σ² / s² | σ / s |
| Units | Squared units (dollars²) | Original units (dollars) |
| Grocery example (sample) | 332.70 | 18.24 |
| How you get it | Average of the squared deviations | Square root of the variance |
| Best for | Calculation and combining spreads | Interpreting and reporting spread |
Read more about how variance breaks down across the bands in our guide to the percentage contribution of standard deviations.
How to Interpret Standard Deviation
For bell-shaped data, the empirical rule turns a standard deviation into percentages: about 68% of values fall within one standard deviation of the mean, about 95% within two, and about 99.7% within three. For the grocery data (mean $154.20, s = $18.24):
| Band | Range ($) | Share of values |
|---|---|---|
| Mean ± 1 SD | 135.96 – 172.44 | 68.27% |
| Mean ± 2 SD | 117.72 – 190.68 | 95.45% |
| Mean ± 3 SD | 99.48 – 208.92 | 99.73% |
So a week of $190 is unremarkable (inside two standard deviations), but a week of $220 would be more than three standard deviations above the mean — genuinely unusual. Draw these bands for your own numbers with the empirical rule graph generator. When your data are not bell-shaped, the empirical rule does not apply — use Chebyshev's theorem instead, which guarantees at least 75% of values within two standard deviations and at least 88.89% within three, for any distribution at all. For the theory behind these rules, see the NIST/SEMATECH e-Handbook of Statistical Methods.
Standard Deviation Practice Problems
Try these three problems, then check your answers. Work by hand first, then check with a calculator.
- Find the population and sample standard deviation of 3, 6, 9, 12 and 15.
Answer: the mean is 9 and the sum of squared deviations is 90. The population variance is 90 ÷ 5 = 18.00, so the population SD is 4.24. The sample variance is 90 ÷ 4 = 22.50, so the sample SD is 4.74. - Find the population and sample standard deviation of 68, 72, 75, 80 and 85.
Answer: the mean is 76 and the sum of squared deviations is 178. The population variance is 178 ÷ 5 = 35.60, so the population SD is 5.97. The sample variance is 178 ÷ 4 = 44.50, so the sample SD is 6.67. - Estimate the standard deviation with the range rule: a data set runs from 28 to 88.
Answer: the range is 88 − 28 = 60, so SD ≈ 60 ÷ 4 = 15.
Verify Your Answer in Our Calculator
Once you know how to find standard deviation by hand, check it: paste the same numbers into the calculator and compare. Enter the grocery spends 147, 163, 129, 178 and 154 and you should get a sample standard deviation of 18.24 and a population standard deviation of 16.31 — exactly the answers worked out above. If your hand calculation disagrees, the usual mistakes are dividing by n instead of n − 1 for a sample, forgetting to square the deviations, or taking the square root too early.
Frequently Asked Questions
What is the standard deviation formula?
The population standard deviation is σ = √(Σ(x − μ)² / N) and the sample standard deviation is s = √(Σ(x − x̄)² / (n − 1)). Use N, the population size, when you have every value; use n − 1, the sample size minus one, when you have a sample.
How do I calculate standard deviation by hand?
Find the mean, subtract the mean from each value, square each deviation, add the squared deviations, divide by N for a population or by n − 1 for a sample to get the variance, then take the square root. For the grocery data 147, 163, 129, 178 and 154, that gives a sample standard deviation of 18.24.
When should I divide by n − 1 instead of N?
Divide by n − 1 when your data are a sample taken from a larger population, because a sample tends to underestimate the population spread and the n − 1 correction (Bessel's correction) fixes that bias. Divide by N only when you have every value in the population.
Can standard deviation be negative?
No. Standard deviation is the square root of a sum of squared values, so it is always zero or positive. It equals zero only when all the values are identical.
What is the difference between variance and standard deviation?
Variance is the average squared distance from the mean, measured in squared units; standard deviation is the square root of the variance, measured in the original units. For the grocery sample, the variance is 332.70 dollars² and the standard deviation is $18.24.
What is a good standard deviation?
There is no universal good value — it depends on the data. Compare the standard deviation with the mean using the coefficient of variation (SD ÷ mean × 100%). The grocery data have a CV of 11.83%, which is fairly tight; a CV above about 30% means the data are highly spread out.
How do I calculate standard deviation in Excel?
Use =STDEV.S(range) for a sample and =STDEV.P(range) for a population. For 10, 20, 30, 40 and 50, =STDEV.P gives 14.14 and =STDEV.S gives 15.81.
How do I estimate standard deviation from the range?
Use the range rule: SD ≈ range ÷ 4. For values running from 52 to 96, the range is 44, so the estimated standard deviation is about 11. It is a rough estimate only — for 10, 20, 30, 40 and 50 it estimates 10, while the true population standard deviation is 14.14.
Check Tools
Put standard deviation into practice with these free tools.
Standard Deviation Calculator
Calculate the mean, variance and standard deviation of any data set, for samples and populations.
ToolsTry Calculator → ● LiveStandard Deviation Shading Tool
Shade the area within one, two or three standard deviations on a bell curve.
ToolsTry Calculator → ● LiveSD Percentage Contribution Calculator
See how much each standard deviation band contributes to the total spread.
ToolsTry Calculator → ● LiveBell Curve Generator
Draw a bell curve for any mean and standard deviation and see the 68-95-99.7 bands.
ToolsTry Calculator → ● LiveZ-Score Calculator
Convert any value to a z-score and find its percentile and probability in one step.
ToolsTry Calculator → ● LiveExplore All Statistical Tools
Browse the full set of free statistics calculators and generators in one place.
ToolsTry Calculator →Check Articles
How to Calculate a Z-Score
A z-score tells you how many standard deviations a value sits from the mean.
ArticleRead Article → ● LiveHow to Read a Z-Table
A z-table is a reference table that gives the area under the standard normal curve to the left of a given z-score.
ArticleRead Article → ● LiveNormal Distribution Examples
Normal distribution examples are everywhere: heights, test scores, measurement errors and blood pressure all follow — or come close to following — a bell-shaped pattern.
ArticleRead Article → ● LiveStandard Normal Distribution
The standard normal distribution is the normal distribution with a mean of 0 and a standard deviation of 1.
ArticleRead Article → ● LiveWhat is the Empirical Rule?
The 68.27%, 95.45% and 99.73% shares explained from the start.
ArticleRead Article → ● LiveNormal Distribution and the Empirical Rule
How the bell curve works, and why it makes the rule possible.
ArticleRead Article →