
How to Calculate a Z-Score
Learning how to calculate a z score is the key to reading any normal distribution. A z-score tells you exactly how far a value sits from the mean, measured in standard deviations — so a test score, a height or an IQ can all be compared on the same scale. This guide shows you how to calculate z score values for a single value and for a full dataset, step by step, with every number checked against a z-score calculator.
Short answer: subtract the mean from the value, then divide by the standard deviation: z = (x − μ) / σ. A score of 85 with a mean of 70 and a standard deviation of 10 gives z = (85 − 70) / 10 = +1.50, which is the 93.32nd percentile.
What Is a Z-Score?
A z-score — also called a standard score — is a number that says how many standard deviations a value is away from the mean of its group. The sign tells you the direction: a positive z-score is above the mean, a negative z-score is below it, and a z-score of 0 is exactly average.
Because z-scores remove the units, they let you compare scores from different tests. A z-score of +1.50 on a maths test and a z-score of +1.50 on a reading test mean the same thing: both scores sit 1.5 standard deviations above their own means. That is why z-scores are used for test scores, IQ scores, heights, manufacturing measurements and converting a z-score into a percentile.
Three quick rules cover most of the interpretation:
- z = 0 — the value equals the mean (50th percentile).
- z = +1 — one standard deviation above the mean (84.13th percentile).
- z = −1 — one standard deviation below the mean (15.87th percentile).
The rest of this guide works through the z-score formula, a five-step method, a full dataset example with a deviation table, and how to reverse the calculation to find a value from a z-score.
Z-Score Formula with Example
There are two versions of the z-score formula. Use the first when you know the population mean and standard deviation, and the second when you are working from a sample of data.
Single value (population): z = (x − μ) / σ, where x is the value, μ is the population mean and σ is the population standard deviation.
From a dataset (sample): z = (x − x̄) / s, where x̄ is the sample mean and s is the sample standard deviation.
The two formulas do the same job — the only difference is which standard deviation you divide by. The population version divides by N; the sample version divides by N − 1. The worked dataset below shows both.
Worked example: one test score
A test has a mean of 70 and a standard deviation of 10. What is the z-score of a score of 85?
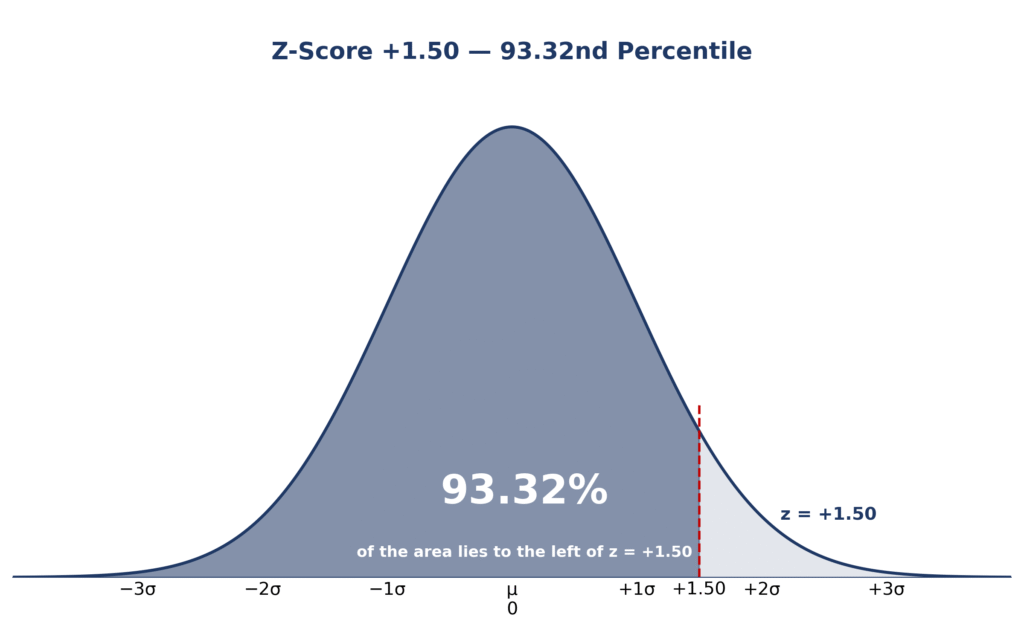
z = (85 − 70) / 10 = 15 / 10 = +1.50. The score is 1.5 standard deviations above the mean, which puts it at the 93.32nd percentile — higher than 93.32% of all scores. You can plot the z-score on a bell curve to see the shaded area for yourself.
Now take a score of 55 from the same test: z = (55 − 70) / 10 = −15 / 10 = −1.50. The negative sign means the score is 1.5 standard deviations below the mean, at the 6.68th percentile. The two scores are mirror images: +1.50 and −1.50 sit the same distance from the mean on opposite sides.
A handy check: z = 0 means the value is exactly the mean, z = +2 is the 97.72nd percentile and z = −2 is the 2.28th percentile. Any value with |z| greater than 3 is rare enough to flag as a possible outlier.
Use these five steps for any value or dataset. The dataset example underneath follows them exactly.
- Step 1 — Find the mean. Add up all the values and divide by how many there are. For a single value, use the mean you are given.
- Step 2 — Find the standard deviation. Work out how spread out the values are around the mean. Divide by N for a whole population, or by N − 1 for a sample.
- Step 3 — Subtract the mean from the value. This gives the deviation: x − μ (or x − x̄ for a sample). A positive deviation is above the mean; a negative one is below it.
- Step 4 — Divide the deviation by the standard deviation. This is the z-score: z = (x − μ) / σ. The units cancel out, leaving a plain number.
- Step 5 — Read the z-score. The sign tells you above or below the mean, the size tells you how far, and a z-score table or calculator turns it into a percentile.
How to Find a Z-Score from Data
Here is the full method applied to five test scores: 10, 20, 30, 40 and 50. Follow the table — every number is shown, so you can check each step.
Step 1 — Mean: (10 + 20 + 30 + 40 + 50) / 5 = 150 / 5 = 30.
Step 2 — Deviations and squared deviations:
| Score (x) | Deviation (x − 30) | Squared deviation |
|---|---|---|
| 10 | −20 | 400 |
| 20 | −10 | 100 |
| 30 | 0 | 0 |
| 40 | +10 | 100 |
| 50 | +20 | 400 |
| Total | 0 | 1,000 |
The deviations add up to 0, which confirms the mean is right. The squared deviations add up to 1,000.
Step 3 — Standard deviation: population variance = 1,000 / 5 = 200, so the population standard deviation is √200 = 14.14. Sample variance = 1,000 / 4 = 250, so the sample standard deviation is √250 = 15.81.
Step 4 — Z-scores: for the top score of 50, z = (50 − 30) / 14.14 = +1.41 with the population standard deviation, or z = (50 − 30) / 15.81 = +1.26 with the sample standard deviation. For the lowest score of 10, z = (10 − 30) / 14.14 = −1.41 (population) or −1.26 (sample). The middle score of 30 gives z = 0, exactly average.
Step 5 — Read the result: the top score sits about 1.4 standard deviations above the mean — about the 92nd percentile with the population standard deviation — while the lowest score mirrors it below the mean. If you want the same numbers without the arithmetic, verify the result in seconds with our free calculator.
Notice how the choice of standard deviation changes the answer: the sample version (dividing by N − 1) gives a slightly larger standard deviation and slightly smaller z-scores. Always say which one you used.
A z-score of 1.5 means the value is 1.5 standard deviations above the mean. On a normal distribution that is the 93.32nd percentile: 93.32% of values fall below it and only 6.68% fall above it. It is a strong score, but not an outlier — outliers usually start beyond |z| = 2 or 3. The diagram above shades exactly this area: everything to the left of z = +1.50. If you want the picture rather than the table, the bell curve generator draws the curve from any mean and SD.
Z-Score vs Percentile
A z-score and a percentile describe the same position in two different units. The z-score counts standard deviations from the mean; the percentile counts the percentage of values below it. Converting between them needs the normal distribution — use a z-score to percentile converter or a z-score table.
| Z-score | Percentile | What it means |
|---|---|---|
| −3 | 0.13th | Only 0.13% of values are lower |
| −2 | 2.28th | About 1 in 44 values is lower |
| −1.5 | 6.68th | Lower than about 93% of values |
| −1 | 15.87th | One SD below the mean |
| 0 | 50th | Exactly the mean |
| +1 | 84.13th | One SD above the mean |
| +1.5 | 93.32nd | Higher than about 93% of values |
| +2 | 97.72nd | About 1 in 44 values is higher |
| +3 | 99.87th | Only 0.13% of values are higher |
This table is the empirical rule in numbers: 68.27% of values fall within one standard deviation of the mean (z between −1 and +1), 95.45% within two, and 99.73% within three. To go further, work out percentiles from a mean and SD with the empirical rule percentile calculator.
One warning: percentiles from a z-score only work when the data is roughly normal. You can calculate a z-score for any dataset, but turning it into a percentile assumes a bell-shaped distribution. If your data is skewed, report the z-score on its own.
How to Find X from a Z-Score
Sometimes you know the z-score and need the original value. Rearrange the formula to x = μ + zσ. For example, what test score sits at z = +1.28 with a mean of 70 and a standard deviation of 10?
x = 70 + 1.28 × 10 = 70 + 12.8 = 82.8. A score of 82.8 is at the 90th percentile. To check the reverse direction — starting from a probability instead — use the probability to z-score tool, which finds the z-score for any percentile.
How to Calculate a Z-Score in Excel
Excel has a built-in function for exactly this: =STANDARDIZE(x, mean, standard_dev). For the worked example above, =STANDARDIZE(85,70,10) returns 1.5. To get the percentile as well, use =NORM.S.DIST(1.5,TRUE), which returns 0.9332 — the 93.32nd percentile.
If you are starting from raw data, calculate the mean with =AVERAGE(A:A), the population standard deviation with =STDEV.P(A:A) and the sample standard deviation with =STDEV.S(A:A). Then any value’s z-score is =(A2-AVERAGE(A:A))/STDEV.P(A:A) for a population, or the same formula with STDEV.S for a sample. STANDARDIZE itself always uses the population standard deviation, so for sample data use the manual formula instead.
Population vs Sample Z-Score
Use the population z-score when you have every value in the group — a whole class, a full production run, all the data there is. Use the sample z-score when your data is only part of a larger group, such as 50 survey responses from a population of thousands. The sample formula divides by N − 1 instead of N, which gives a slightly larger standard deviation and slightly smaller z-scores, as the five-score example above shows (1.41 vs 1.26 for the top score). If a textbook or exam question just says “mean 70, SD 10”, it means the population values, so use z = (x − μ) / σ.
Common Mistakes When Calculating a Z-Score
- Using the variance instead of the standard deviation. The formula divides by σ, not σ². Take the square root first.
- Mixing up population and sample standard deviations. Dividing by N when you should divide by N − 1 (or the reverse) changes every z-score.
- Dropping the minus sign. A z-score of −1.50 is below the mean; +1.50 is above it. The sign is half the answer.
- Reading the z-table backwards. Most tables give the area to the left of z. The area to the right is 1 minus that value — for z = +1.50, the upper tail is 1 − 0.9332 = 0.0668.
- Rounding the standard deviation too early. Keep at least two extra digits until the final division, or your z-score will drift.
- Turning a z-score into a percentile for skewed data. The percentile reading assumes a normal distribution; for anything else, check the shape first — or shade the standard deviations on a bell curve to see the areas.
Can a Z-Score Be Negative?
Yes. A negative z-score simply means the value is below the mean. A z-score of −1.50 is 1.5 standard deviations below the mean, at the 6.68th percentile. Negative z-scores are just as common as positive ones in any real dataset — about half of all values sit below the mean.
What Is a Good Z-Score?
There is no universal “good” z-score — it depends on what you are measuring. For a test, a z-score of +1 or higher (84th percentile and up) is a strong result; for a manufacturing measurement, a z-score near 0 means the part is close to target, and a large |z| means it is out of spec. As a rough guide, |z| under 1 is typical, |z| between 1 and 2 is unusual, and |z| above 2 deserves a second look.
What Z-Score Is Considered an Outlier?
Values beyond |z| = 2 are often flagged as possible outliers, and values beyond |z| = 3 almost always are: only 0.27% of values in a normal distribution fall outside three standard deviations. Before deleting an outlier, check whether it is a data-entry error or a genuine extreme value — a z-score flags the value, it does not explain it. For the statistical background, see the NIST/SEMATECH e-Handbook of Statistical Methods.
Frequently asked questions
What is the formula for a z-score?
The formula is z = (x − μ) / σ, where x is the value, μ is the mean and σ is the standard deviation. For a sample, use z = (x − x̄) / s with the sample mean and sample standard deviation.
How do you calculate a z-score step by step?
Find the mean, find the standard deviation, subtract the mean from the value, divide the difference by the standard deviation, then read the sign and size. For a score of 85 with mean 70 and SD 10, that gives z = (85 − 70) / 10 = +1.50.
What does a z-score of 1.5 mean?
It means the value is 1.5 standard deviations above the mean — the 93.32nd percentile. Only 6.68% of values are higher.
What does a negative z-score mean?
A negative z-score means the value is below the mean. For example, z = −1.50 is 1.5 standard deviations below the mean, at the 6.68th percentile.
How do I calculate a z-score in Excel?
Use =STANDARDIZE(x, mean, standard_dev) — for example, =STANDARDIZE(85,70,10) returns 1.5. For the percentile, add =NORM.S.DIST(1.5,TRUE), which returns 0.9332.
What is the difference between a z-score and a percentile?
A z-score measures distance from the mean in standard deviations; a percentile measures the percentage of values below a score. A z-score of +1.50 and the 93.32nd percentile describe the same position in different units.
When should I use the population vs the sample z-score?
Use the population version (divide by N) when you have the whole group, and the sample version (divide by N − 1) when you only have part of it. In the five-score example, the top score is z = +1.41 with the population standard deviation and z = +1.26 with the sample standard deviation.
Can a z-score be greater than 3?
Yes. A z-score can be any number, positive or negative. Values beyond |z| = 3 are just very rare — only 0.27% of values in a normal distribution fall that far from the mean — so they are usually flagged as possible outliers.
Check Tools
Try these free tools to check your z-score or skip the arithmetic altogether:
Z-Score Calculator
Turn any value into a z-score, percentile and probability.
ToolsTry Calculator → ● LiveZ-Score Graph Plotter
Plot a z-score on a bell curve and shade the area it cuts off.
ToolsTry Calculator → ● LiveZ-Score to Percentile Converter
Convert any z-score into its exact percentile in one step.
ToolsTry Calculator → ● LiveProbability to Z-Score Approximation Tool
Work backwards from a probability to the z-score that produces it.
ToolsTry Calculator → ● LiveBell Curve Generator
Draw a bell curve from any mean and SD and download it as a PNG.
ToolsTry Calculator → ● LiveEmpirical Rule Percentile Calculator
Convert percentiles to values with a mean and SD.
ToolsTry Calculator → ● LiveExplore All Statistical Tools
Browse every free calculator on this site.
ToolsTry Calculator →Check Articles
What is the Empirical Rule?
The 68.27%, 95.45% and 99.73% shares explained from the start.
ArticleRead Article → ● LiveNormal Distribution and the Empirical Rule
How the bell curve works, and why it makes the rule possible.
ArticleRead Article → ● LiveHow to Use Empirical Rule Calculator
Worked steps for the calculator, from mean and standard deviation to results.
ArticleRead Article → ● LiveReal-Life Applications of Percentiles in Normal Distribution
Real-life applications of percentiles in normal distribution turn a score into a rank.
ArticleRead Article → ● LiveEmpirical Rule vs. Confidence Intervals: What’s the Difference?
The empirical rule and the confidence interval are not the same thing.
ArticleRead Article →