What is an IQ bell curve?
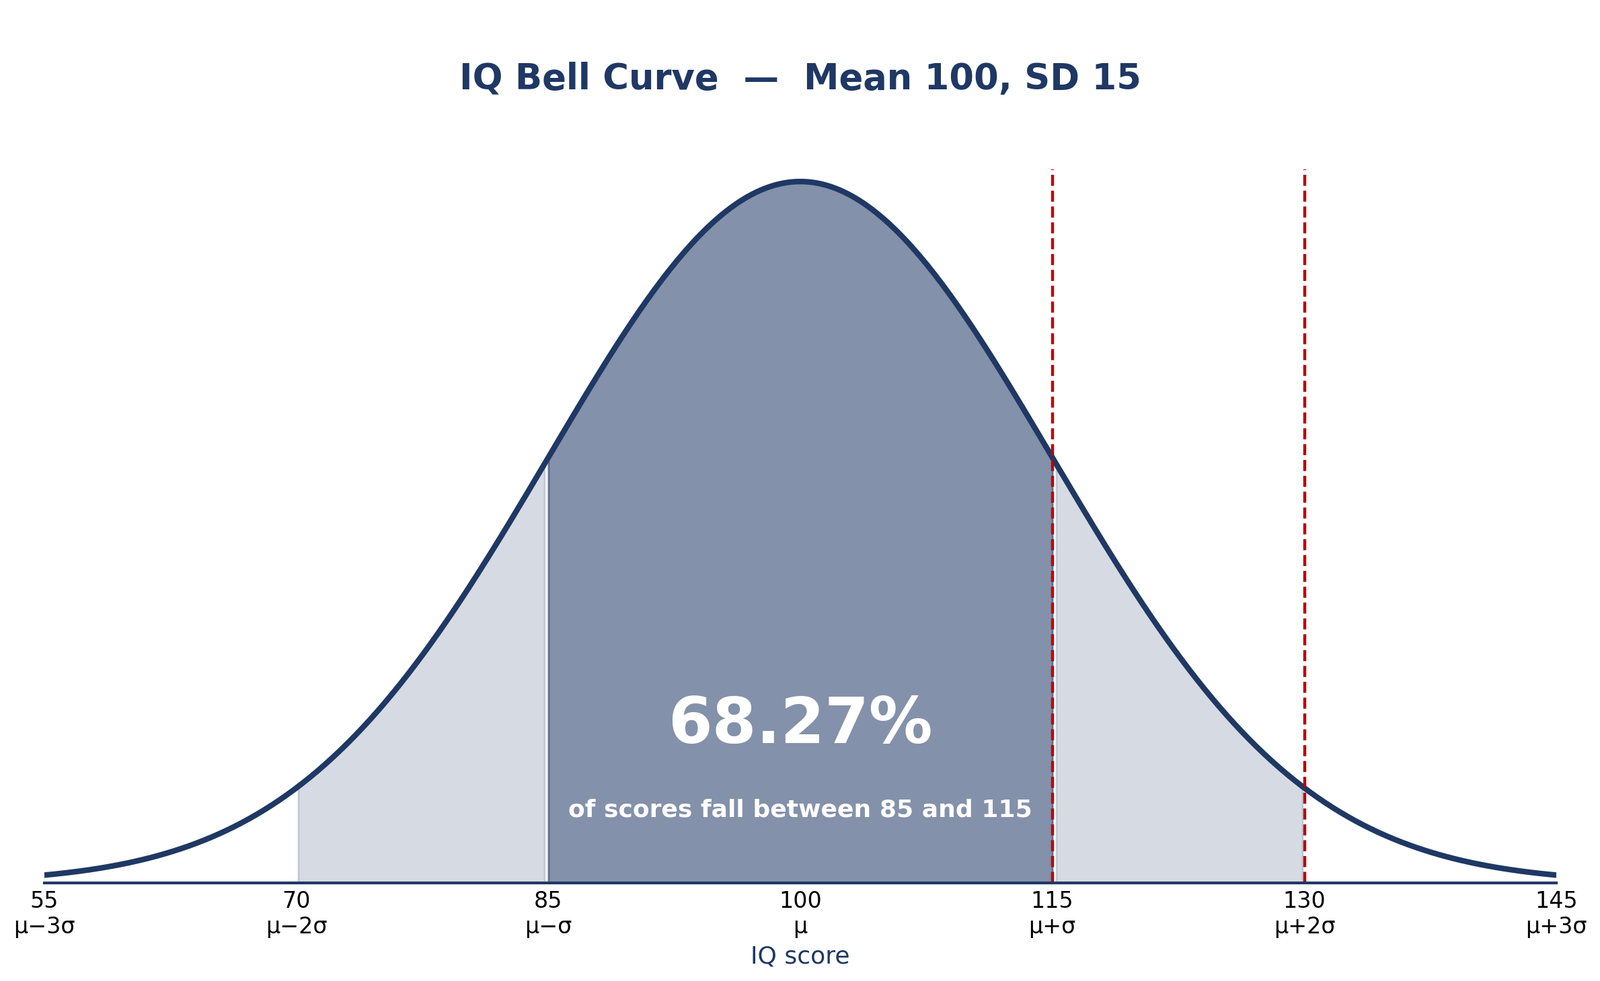
An IQ bell curve is the normal distribution of IQ scores in a population. On the Wechsler scale it is centred on a mean of 100 with a standard deviation of 15, so most people cluster near the middle and very high or very low scores are rare. About 68.27% of scores fall between 85 and 115, about 95.45% fall between 70 and 130, and about 99.73% fall between 55 and 145. Those are the exact figures behind the empirical rule (the 68-95-99.7 rule), and they explain how much of the curve each standard deviation contributes. Because IQ scores are designed to follow this curve, a single score can be turned into a percentile: the share of the population that scores at or below it. If you want to draw a curve of your own, try our bell curve generator or the normal distribution percentile visualizer. First, though, remember that a percentile is a ranking, not a percentage of questions answered correctly, as explained in our guide to how percentiles and probabilities differ.
What percentile is an IQ of 115?
An IQ of 115 is at the 84.13th percentile on the Wechsler scale (mean 100, SD 15). Its z-score is +1.00, because (115 − 100) ÷ 15 = 1. That means about 84 in every 100 people score at or below 115, and about 16 in 100 score above it, which is roughly 1 in 6 people. In Wechsler terms, 115 sits at the top of the High Average band (110–119).
What IQ is the 90th percentile?
The 90th percentile is an IQ of about 119 on the Wechsler scale. The z-score for the 90th percentile is +1.28, so 100 + 1.28 × 15 = 119.2, which rounds to 119. On the Stanford-Binet scale (SD 16) the same percentile is about 120, and on the Cattell scale (SD 24) it is about 131 — the percentile is the same, but the score changes because each test stretches its scale differently. Use the reverse mode of the calculator above to convert any percentile to an IQ score.
Is 130 IQ gifted?
An IQ of 130 is at the 97.72nd percentile, so it is higher than about 98 in every 100 people, or roughly 1 in 44. On the Wechsler scale, 130 and above is labelled Very Superior, and many gifted programmes use 130 as a qualifying threshold. But a single number is not a diagnosis: gifted identification usually looks at several kinds of evidence, test scores vary between sittings, and different tests use different scales, so a 130 on one test is not identical to a 130 on another. Treat 130 as strong evidence of high ability on that test, not as a complete picture of a person.
IQ percentile reference table
The table below uses the Wechsler scale (mean 100, SD 15) and exact normal-distribution percentiles. It is the quickest way to read off the scores people ask about most.
| IQ score | Z-score | Percentile | Rarity | Wechsler band |
|---|---|---|---|---|
| 70 | −2.00 | 2.28th | 1 in 44 | Borderline |
| 85 | −1.00 | 15.87th | 1 in 6 | Low Average |
| 100 | 0.00 | 50th | 1 in 2 | Average |
| 115 | +1.00 | 84.13th | 1 in 6 | High Average |
| 130 | +2.00 | 97.72nd | 1 in 44 | Very Superior |
| 145 | +3.00 | 99.87th | 1 in 741 | Very Superior |
Notice the symmetry: 85 and 115 are each one standard deviation from the mean, so they are equally far from average in opposite directions, and 70 and 130 are each two standard deviations away.
How to calculate an IQ percentile
You can work out any IQ percentile by hand in five steps. The calculator above does the same arithmetic with the exact normal distribution, so you can check your working against it.
- Note the score and the scale. Write down the IQ score and the standard deviation of its test: 15 for Wechsler, 16 for Stanford-Binet, 24 for Cattell.
- Find the z-score. Subtract the mean, 100, from the IQ score and divide by the standard deviation: z = (IQ − 100) ÷ SD.
- Look up the normal curve. Find the area under the standard normal curve to the left of that z-score. That area is the cumulative probability, and you can also get it from a z-score to percentile converter or by asking how to plot a z-score on a bell curve.
- Turn it into a percentile. Multiply the area by 100. An area of 0.8413 becomes the 84.13th percentile.
- Read the band and the rarity. Match the score to its Wechsler band and work out the rarity: above the median, 1 in N is 1 ÷ (1 − percentile), and below it, 1 ÷ percentile.
Worked example: for an IQ of 130 on the Wechsler scale, z = (130 − 100) ÷ 15 = 2.00. The area to the left of z = 2.00 is 0.9772, so the percentile is 97.72. Only 2.28% score above 130, which is 1 ÷ 0.0228, or about 1 in 44 people.
IQ scales: Wechsler, Stanford-Binet and Cattell
IQ scores only make sense with their scale attached. The Wechsler tests (WAIS and WISC) use a mean of 100 and a standard deviation of 15, the Stanford-Binet uses a standard deviation of 16, and the Cattell test uses a standard deviation of 24. The same ability therefore gets a different number on each test: an IQ of 115 on the Wechsler scale is one standard deviation above the mean, but on the Cattell scale one standard deviation above the mean is 124, so a Wechsler 115 is only 0.63 standard deviations above the mean on the Cattell scale. Comparing scores across tests is only meaningful after converting them to z-scores or percentiles, which is why this calculator lets you switch between SD 15, 16 and 24. Always check which scale a score came from before you interpret it.
| Wechsler band | IQ range | Percentile range |
|---|---|---|
| Extremely Low | Below 70 | Below the 2.28th |
| Borderline | 70–79 | 2.28th to 9.12th |
| Low Average | 80–89 | 9.12th to 25.25th |
| Average | 90–109 | 25.25th to 72.57th |
| High Average | 110–119 | 72.57th to 89.74th |
| Superior | 120–129 | 89.74th to 97.34th |
| Very Superior | 130 and above | 97.72nd and above |
What does an IQ of 115 mean?
An IQ of 115 means scoring higher than about 84 in every 100 people on the same test, with a z-score of +1.00 and a High Average classification. It is a solidly above-average result, one full standard deviation above the mean, but it is not unusual: roughly 1 in 6 people score at least this high. It does not mean getting 115% of the questions right, and it says nothing on its own about a person's school grades, job performance or creativity, which all depend on far more than one test score.
How rare is an IQ of 145?
An IQ of 145 is very rare. On the Wechsler scale its z-score is +3.00, its percentile is the 99.87th, and only about 0.13% of people score above it, which is roughly 1 in 741 people. Scores this high sit at the edge of what most IQ tests can measure reliably, because tests have a ceiling: beyond a certain point there are too few hard questions to separate one very high score from another. That is why a result near the top of a test's range should be read with care, and why the top 2% — the usual threshold for high-IQ societies — starts much lower, at about IQ 131.
IQ bell curve chart
The diagram below shows the IQ bell curve with a mean of 100 and a standard deviation of 15. The middle band, from 85 to 115, holds 68.27% of all scores, the bands from 70 to 130 hold 95.45%, and almost everyone — 99.73% — falls between 55 and 145. The chart drawn by the calculator above marks your own score on the same curve and shades the area below it, which is exactly the percentile.
Frequently asked questions
What percentile is an IQ of 115?
An IQ of 115 is at the 84.13th percentile on the Wechsler scale (mean 100, SD 15). Its z-score is +1.00, its classification is High Average, and about 1 in 6 people score at least this high.
What IQ is the 90th percentile?
The 90th percentile is an IQ of about 119 on the Wechsler scale (SD 15), about 120 on the Stanford-Binet scale (SD 16) and about 131 on the Cattell scale (SD 24). The z-score for the 90th percentile is +1.28.
Is 130 IQ gifted?
An IQ of 130 is at the 97.72nd percentile, or about 1 in 44 people, and is labelled Very Superior on the Wechsler scale. Many gifted programmes use 130 as a threshold, but gifted identification normally uses more than one measure, and the test and scale matter.
What percentile is an IQ of 100?
An IQ of 100 is at the 50th percentile, exactly in the middle of the bell curve. Half of the population scores at or below 100 and half scores above it, so 100 is the average score by definition.
How rare is an IQ of 145?
An IQ of 145 is at the 99.87th percentile with a z-score of +3.00. Only about 0.13% of people score above it, which is roughly 1 in 741 people.
What does an IQ of 115 mean?
An IQ of 115 means scoring higher than about 84 in every 100 people on the same test. It is one standard deviation above the mean, classified as High Average, and about 1 in 6 people score this high or higher.
What is the difference between SD 15, 16 and 24?
They are the standard deviations of the three main IQ scales: Wechsler uses 15, Stanford-Binet uses 16 and Cattell uses 24, all with a mean of 100. The same percentile gives a different IQ number on each scale, so always convert scores to z-scores or percentiles before comparing them.
Is this an IQ test?
No. This is an educational statistics tool, not an IQ test. It converts an IQ score you already have into a percentile, a z-score, a rarity figure and a classification band. It cannot measure intelligence, and a real IQ assessment should only be given by a qualified professional using a standardised test.
About this tool
This IQ bell curve calculator uses the exact standard normal distribution, not the 68-95-99.7 approximation, so its percentiles are precise to two decimal places. The normal curve itself is described in the NIST/SEMATECH e-Handbook of Statistical Methods. If you want to explore further, you can shade an area under a bell curve, or browse all our free tools for normal distributions, z-scores and percentiles.