Standard Deviation Calculator
A standard deviation calculator finds how spread out a set of numbers is. Paste your data, and it returns the mean, variance and standard deviation for both a population and a sample. For example, 10, 20, 30, 40, 50 has a mean of 30, a population standard deviation of 14.14 and a sample standard deviation of 15.81.
Standard Deviation Calculator
Paste your numbers below, separated by commas, spaces or line breaks. The calculator shows the population and sample results side by side, with every step worked out.
How to calculate standard deviation
To calculate standard deviation by hand, work through five steps. First, add all the values and divide by how many there are to find the mean. Second, subtract the mean from each value to get each deviation. Third, square every deviation, so negative and positive gaps both count. Fourth, add the squared deviations and divide by n for a population, or by n − 1 for a sample, to get the variance. Fifth, take the square root of the variance. That square root is the standard deviation.
The standard deviation formula makes this precise. For a population, σ = √[Σ(x − μ)² / N], where μ is the population mean and N is the number of values. For a sample, s = √[Σ(x − x̄)² / (n − 1)], where x̄ is the sample mean and n is the sample size. The only difference is the divisor, but it matters: dividing by n − 1 gives a slightly larger result, which corrects for the fact that a sample usually underestimates the spread of the whole population.
Variance is the middle step, not the final answer. It is the average squared deviation, so its units are squared units — squared points, squared centimetres, and so on. Taking the square root brings the answer back into the original units, which is why the standard deviation is easier to interpret than the variance. A standard deviation of 14.14 points, for example, can be compared directly with the test scores it came from.
Worked example: 2, 4, 4, 4, 5, 5, 7, 9
This classic dataset is a good check of any standard deviation formula, because every step comes out cleanly. First, the total is 40 and there are 8 values, so the mean is 40 ÷ 8 = 5. The deviations from 5 are −3, −1, −1, −1, 0, 0, 2 and 4. Squaring them gives 9, 1, 1, 1, 0, 0, 4 and 16, which add up to 32.
For the population, divide 32 by 8 to get a variance of 4, and √4 = 2.00. For the sample, divide 32 by 7 to get a variance of 4.57, and √4.57 = 2.14. So the population standard deviation is 2.00 and the sample standard deviation is 2.14. Try the same numbers in the calculator above and you should see exactly the same table.
Population vs sample standard deviation: when to divide by n or n − 1
Use the population standard deviation when you have every value you care about. If you measured the heights of all 30 pupils in one class, that class is your population, so divide by n = 30. Use the sample standard deviation when your data are only a sample from a larger group you want to describe. If you measured 30 adults to estimate the spread of heights in a whole city, divide by n − 1 = 29.
The n − 1 divisor is called Bessel’s correction. A sample mean is fitted to the same data, which pulls the deviations slightly towards zero, so dividing by n would understate the true spread on average. The correction is largest for small samples: with n = 5 it raises the variance by a quarter, but with n = 100 it raises it by only about one per cent. When in doubt in school and exam work, check what the question asks for; in research, the sample version is the usual default. Once you have the standard deviation, you can use our z-score calculator to turn any single value into a z-score.
What does standard deviation tell you?
Standard deviation tells you how far a typical value sits from the mean. A small standard deviation means the values cluster tightly around the mean; a large one means they are widely spread. Two classes can both average 70 marks yet feel very different: a standard deviation of 5 means most pupils scored roughly 65 to 75, while a standard deviation of 15 means scores from 55 to 85 are common. The mean alone hides that difference.
Standard deviation is also the bridge to the normal distribution. For roughly bell-shaped data, about 68% of values fall within one standard deviation of the mean, about 95% within two, and about 99.7% within three — the 68-95-99.7 rule. With a mean of 100 and a standard deviation of 15, that means about 68% of values fall between 85 and 115, about 95% between 70 and 130, and about 99.7% between 55 and 145. Learn more about what the empirical rule is and how those percentages work, or explore the same idea with our normal distribution calculator.
A larger standard deviation makes the curve wider and flatter
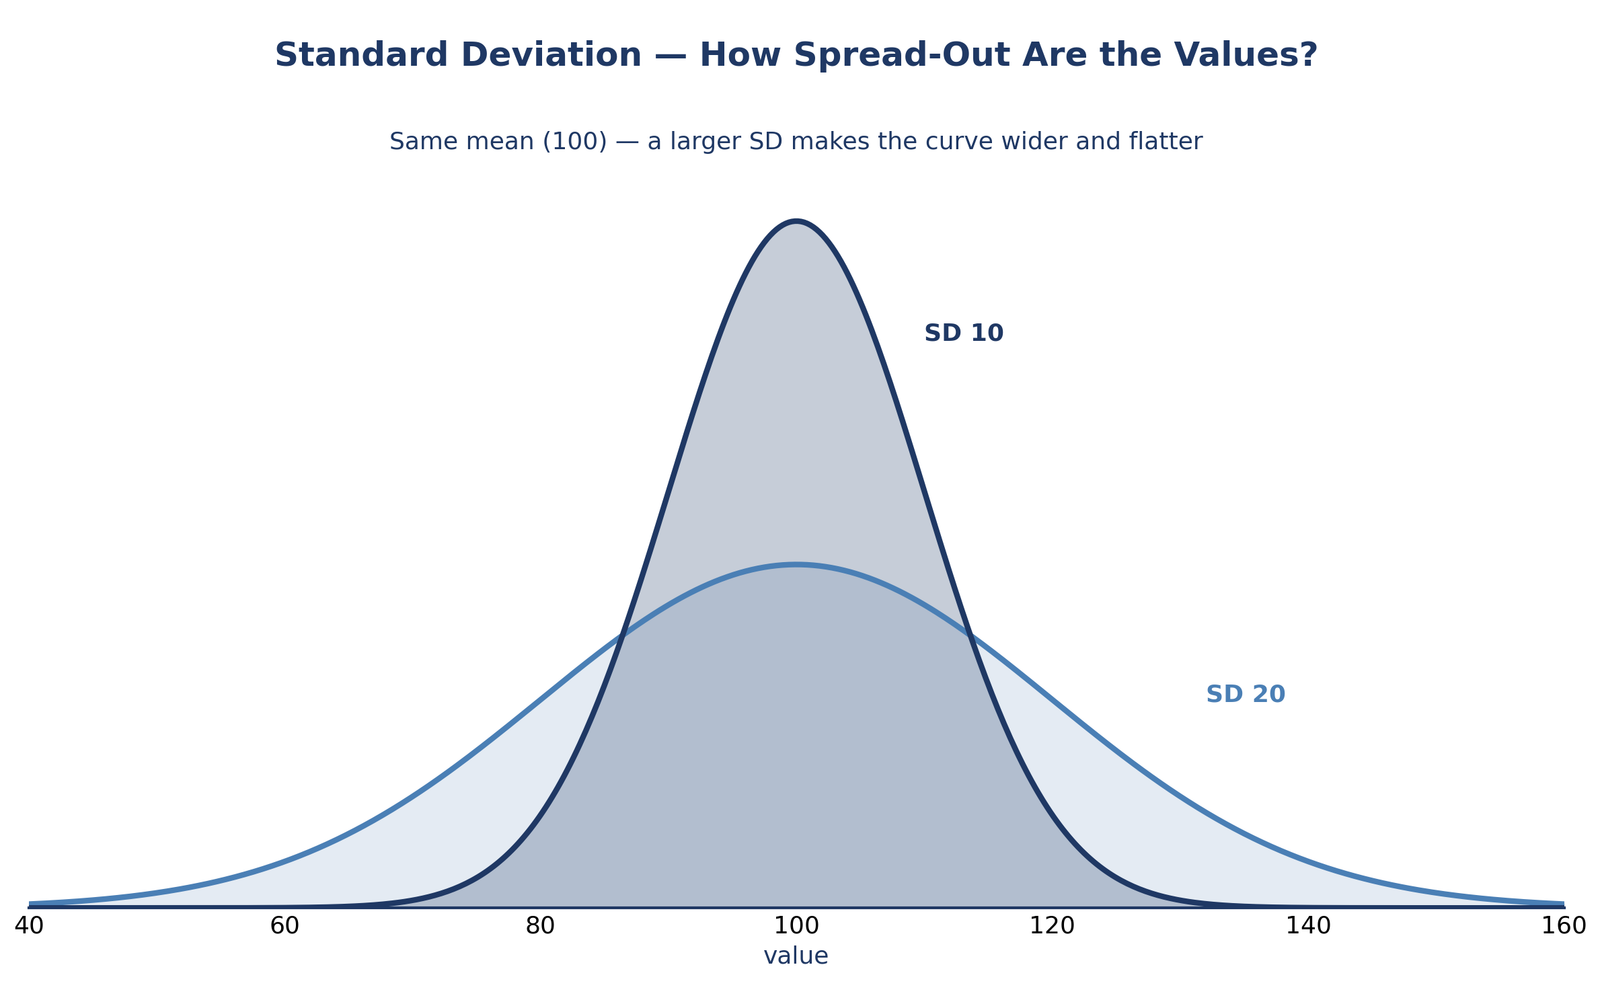
The picture below shows two normal curves with the same mean of 100. The curve with a standard deviation of 10 is tall and narrow, because most values sit close to 100. The curve with a standard deviation of 20 is shorter, wider and flatter, because the same total area is stretched over a broader range of values. That is the whole visual meaning of standard deviation: it controls the width of the bell. You can see the same effect interactively with our standard deviation shading tool, and read how each standard deviation contributes to the total percentage under the curve in our guide to how each standard deviation contributes to the total percentage.
The range rule: estimate standard deviation as range ÷ 4
The range rule of thumb says the standard deviation is roughly the range divided by 4: SD ≈ (maximum − minimum) / 4. It works because, for roughly bell-shaped data, almost all values lie within about two standard deviations either side of the mean, so the full range spans about four standard deviations. It is an estimate, not a calculation, and it is most useful when you only know the highest and lowest values.
For example, if exam scores run from 52 to 96, the range is 44 and the range-rule estimate is 44 / 4 = 11. The real standard deviation might be 9 or 13, but 11 is a sensible quick check. Do not use the rule on skewed data or data with an extreme outlier, because one stray value inflates the range and the estimate with it. For an exact answer, paste the full dataset into the calculator at the top of this page instead.
Standard deviation in Excel
To find standard deviation in Excel, use =STDEV.P for a population and =STDEV.S for a sample. Put your numbers in a column, for example A1:A5, then type =STDEV.P(A1:A5) in a blank cell for the population result or =STDEV.S(A1:A5) for the sample result. For 10, 20, 30, 40, 50 in A1:A5, =STDEV.P(A1:A5) returns 14.14 and =STDEV.S(A1:A5) returns 15.81, exactly matching the calculator above.
The older functions =STDEVP and =STDEV do the same jobs — STDEVP is the population version and STDEV is the sample version — but Microsoft now recommends STDEV.P and STDEV.S because the names make the choice clear. Google Sheets uses the same two functions, =STDEV.P and =STDEV.S. If you need the variance instead, use =VAR.P and =VAR.S. For an IQ example worked the same way, try our IQ bell curve calculator.
Practice problems
Try these by hand first, then check each one with the calculator above.
1. Find the population and sample standard deviation of 3, 6, 9, 12, 15. Answer: the mean is 9 and the sum of squared deviations is 90, so the population variance is 18 and the population standard deviation is 4.24; the sample variance is 22.50 and the sample standard deviation is 4.74.
2. Five exam scores are 68, 72, 75, 80 and 85. Find both standard deviations. Answer: the mean is 76 and the sum of squared deviations is 178, so the population standard deviation is 5.97 and the sample standard deviation is 6.67.
3. Use the range rule to estimate the standard deviation of scores that run from 28 to 88. Answer: the range is 60, so the estimate is 60 / 4 = 15.
Frequently asked questions
How do I calculate standard deviation?
Find the mean, subtract it from each value, square each deviation, add the squared deviations, divide by n for a population or by n − 1 for a sample, and take the square root. The calculator above does all five steps and shows the full working table.
What is the standard deviation of 10, 20, 30, 40, 50?
The mean is 30 and the sum of squared deviations is 1000. The population standard deviation is 14.14 and the sample standard deviation is 15.81.
What is the difference between population and sample standard deviation?
The population standard deviation divides the sum of squared deviations by n and describes a complete set of values. The sample standard deviation divides by n − 1 and estimates the spread of a larger population from a sample. The sample value is always slightly larger.
What does standard deviation tell you?
It tells you how spread out the values are around the mean, in the same units as the data. A small standard deviation means the values cluster near the mean; a large one means they are widely spread. For bell-shaped data it also sets the 68%, 95% and 99.7% bands around the mean.
What is a good standard deviation?
There is no universal good value, because standard deviation is measured in the same units as the data. A standard deviation of 5 marks is small for exam scores out of 100 but huge for a variable measured in millimetres. Judge it against the mean and the context, or compare it with the standard deviation of a similar dataset.
How do I calculate standard deviation in Excel?
Use =STDEV.P(range) for a population and =STDEV.S(range) for a sample. For example, =STDEV.P(A1:A5) returns 14.14 for the values 10, 20, 30, 40, 50, while =STDEV.S(A1:A5) returns 15.81.
Can standard deviation be zero or negative?
Standard deviation can be zero, but never negative. It is zero only when every value is identical, as with 100, 100, 100, 100. It is a square root, and square roots of the (non-negative) variance are never negative.
What is the difference between standard deviation and variance?
Variance is the average squared deviation from the mean, and standard deviation is its square root. Variance is measured in squared units, while standard deviation is in the original units, so the standard deviation is the one to quote when you describe spread in plain terms.
Keep exploring: build a curve with our bell curve generator, shade the 68-95-99.7 bands with our empirical rule graph generator, or browse all our free statistics tools. For the formal definitions behind these formulas, see the NIST/SEMATECH e-Handbook of Statistical Methods.