What is a p-value?
A p-value is the probability of getting a test statistic at least as extreme as the one you observed, if the null hypothesis is true. For a z-test it is an area under the standard normal curve: the area beyond your z-score in one tail, or beyond ±z in both tails. A small p-value means your result would be unusual if the null were true; a large p-value means it is perfectly ordinary under the null.
A p-value is not the probability that the null hypothesis is true, and it is not the probability that your result happened by chance. It is a conditional probability: it assumes the null is true and asks how surprising the data look under that assumption. A p-value of 0.0357, for example, says a result this extreme would occur about 3.57% of the time if the null were true — it does not say there is a 3.57% chance the null is true.
In a z-test the p-value is found from the z-score. For a sample mean the z-score is z = (x̄ − μ₀) ÷ (σ ÷ √n), where x̄ is the sample mean, μ₀ is the mean under the null hypothesis, σ is the population standard deviation and n is the sample size. Once you have z, the p-value is the tail area — which is exactly what the calculator above finds. If you do not have a z-score yet, our z-score calculator turns a raw score, mean and standard deviation into one.
How to find the p-value from a z-score
The calculator at the top of this page does this in one step, but the hand method is worth knowing — it is exactly what this p-value from z-score tool does, and it is the method examiners expect.
- Find Φ(z), the area to the left of your z-score under the standard normal curve. Read it from a z-table, or use our normal distribution calculator.
- Take the tail area. For a right-tailed test the one-tailed p-value is 1 − Φ(z); for a left-tailed test it is Φ(z).
- Double it for a two-tailed test: p = 2 × (1 − Φ(|z|)).
Worked example: z = 2.10
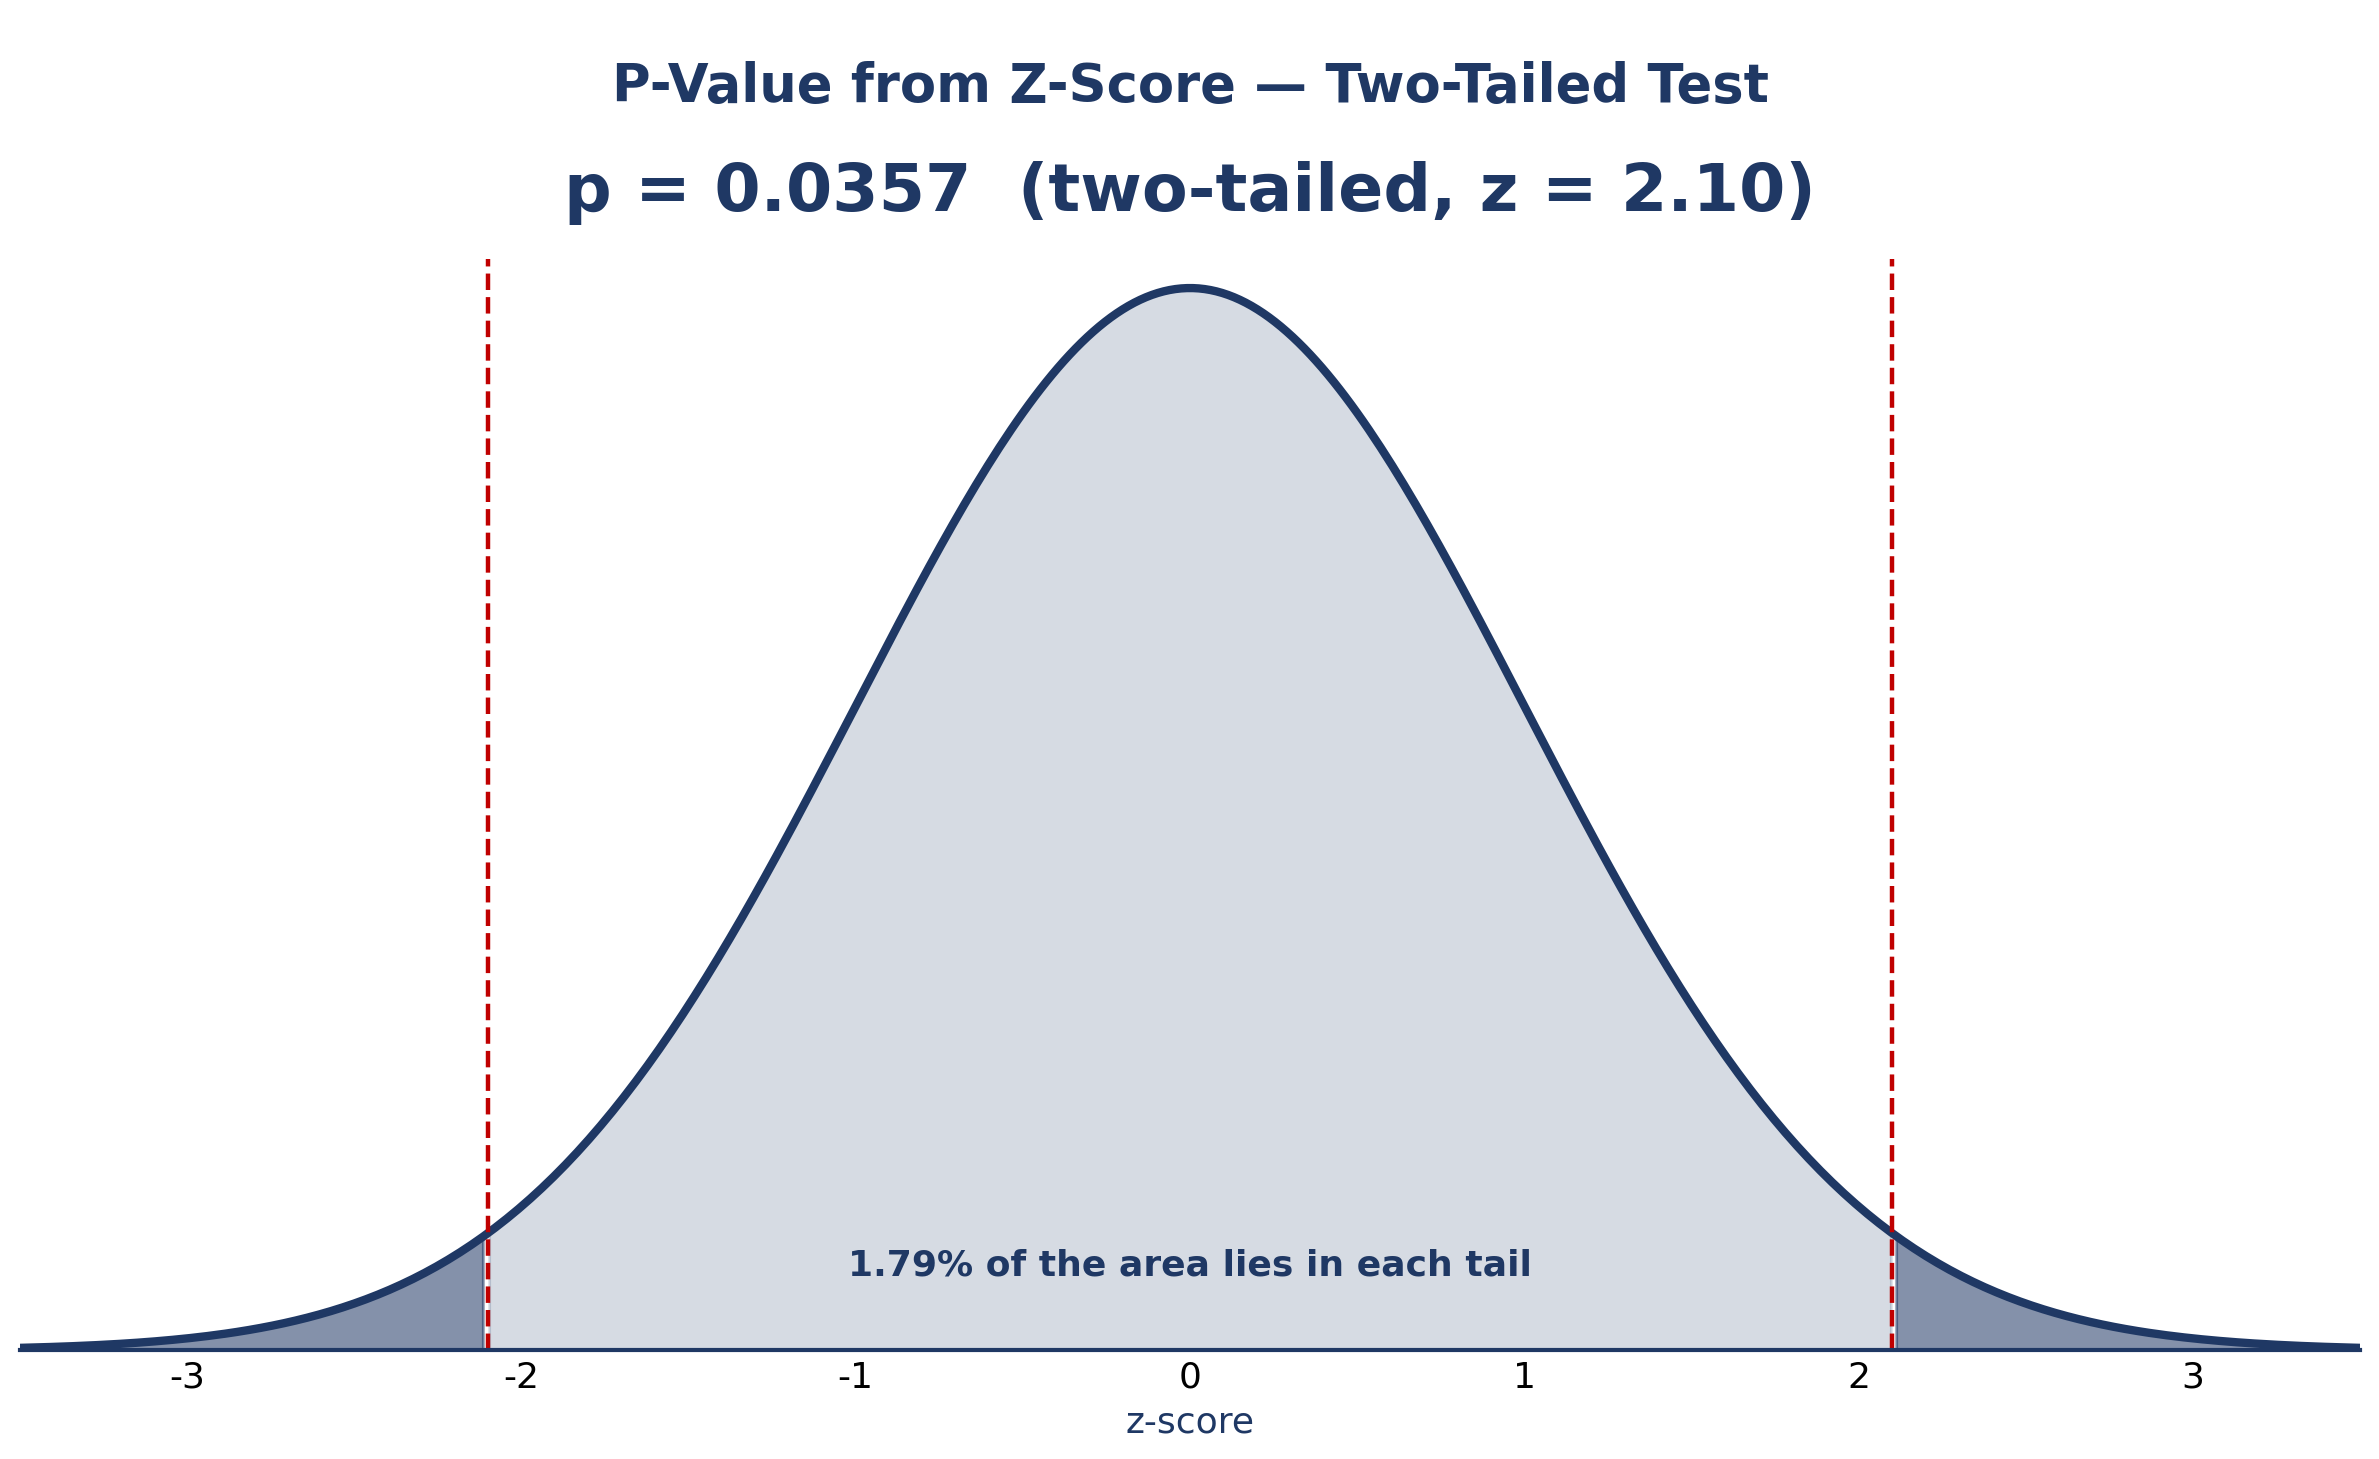
Take z = 2.10. From the z-table, Φ(2.10) = 0.9821, so 98.21% of the curve lies to the left of z = 2.10. The one-tailed p-value is 1 − 0.9821 = 0.0179, and the two-tailed p-value is 2 × 0.0179 = 0.0357. Because 0.0357 is below 0.05, the result is statistically significant at the 5% level. Try it in the calculator: enter 2.10, choose two-tailed, and it returns 0.0357 with both tails shaded on the curve. These tail areas are the same numbers our tool for left- and right-tail probabilities reports for any z-score.
One-tailed vs two-tailed p-value
A one-tailed p-value counts the area in one tail only — use it when your hypothesis predicts a direction before you see the data, for example that a new drug lowers blood pressure. A two-tailed p-value counts both tails — use it when you only ask whether there is any difference, in either direction. For the same z-score the two-tailed p-value is exactly twice the one-tailed one: z = 2.10 gives 0.0179 one-tailed and 0.0357 two-tailed. If you are unsure which to use, choose two-tailed: it is the conservative, standard choice in most research.
Switching to a one-tailed test after seeing the result — for example, because the data happen to look strong in one direction — inflates the false-positive rate and is not valid. The direction must be chosen before the data are collected. A one-tailed p-value is also the complement of a percentile, since Φ(z) is a percentile: the z-score to percentile converter shows the same area from the other side.
P-value from z-score table
These common z-scores and their p-values are worth memorising — they are the critical values you will meet again and again. This p-value table gives the one-tailed p (the area beyond z in one direction) and the two-tailed p (the area in both tails).
| z-score | One-tailed p | Two-tailed p |
|---|---|---|
| 1.00 | 0.1587 | 0.3173 |
| 1.28 | 0.1003 | 0.2005 |
| 1.645 | 0.0500 | 0.1000 |
| 1.96 | 0.0250 | 0.0500 |
| 2.10 | 0.0179 | 0.0357 |
| 2.33 | 0.0099 | 0.0198 |
| 2.58 | 0.0049 | 0.0099 |
Read it this way: z = 1.96 is the 5% two-tailed critical value and z = 2.58 is the 1% two-tailed critical value. A z of 2.10 sits between them, which is why its two-tailed p-value, 0.0357, is significant at the 5% level but not at the 1% level. If you need the reverse — the z-score for a given tail area — our probability to z-score tool finds it.
What does p < 0.05 mean?
p < 0.05 means the observed result would occur less than 5% of the time if the null hypothesis were true, so the result is called statistically significant and the null hypothesis is rejected at the 5% level. For example, p = 0.0357 for z = 2.10 is below 0.05, so it is significant; p = 0.3173 for z = 1.00 is not.
That is all it means. A p-value below 0.05 does not mean there is a 95% chance the alternative hypothesis is true, and it says nothing about how large or important the effect is. A tiny p-value can come from a trivial effect measured in a huge sample, while a large p-value is not proof that the null is true — only that these data do not contradict it.
Common thresholds are 0.05 for significant, 0.01 for highly significant and 0.001 for very highly significant. Always report the exact p-value — 0.0357, not just “p < 0.05” — because the exact number carries more information, and 0.05 itself is a convention rather than a law of nature. The same standard normal curve sits behind IQ scores, as the IQ bell curve calculator shows, and about 95% of it lies within z = ±1.96 — which is why 1.96 is the 5% two-tailed critical value, as explained in what the empirical rule says about the 68–95–99.7 split.
How to use the p-value calculator
- Choose a mode: “Z-Score → P-Value” or “P-Value → Z-Score (Reverse)”.
- Enter your z-score (or p-value) and pick one-tailed (left or right) or two-tailed.
- Click “Calculate p-value” (or “Find z-score”) and read the p-value, the one- and two-tailed values, and the shaded bell curve.
The chart shades the tail area that the p-value measures, so you can see exactly what the number means. The calculator converts any z to p value — or any p-value back to a z-score — using the exact standard normal cumulative distribution, with no tables and no rounding beyond four decimal places.
P-value calculator FAQs
How do I find the p-value from a z-score?
Find the area to the left of the z-score under the standard normal curve, Φ(z). For a right-tailed test, the p-value is 1 − Φ(z); for a left-tailed test, it is Φ(z); for a two-tailed test, double the one-tailed value. For z = 2.10: Φ(2.10) = 0.9821, so the one-tailed p-value is 0.0179 and the two-tailed p-value is 0.0357. The calculator above does all three in one click.
What is the p-value of z = 2.10?
The p-value of z = 2.10 is 0.0357 two-tailed and 0.0179 one-tailed. That is, 1.79% of the standard normal curve lies beyond z = 2.10 in each tail. It is below 0.05, so the result is statistically significant at the 5% level.
What is a p-value in simple terms?
A p-value is the probability of seeing a result at least as extreme as yours, if the null hypothesis were true. A small p-value (usually under 0.05) means your result would be surprising under the null, so you reject the null. It is not the probability that the null hypothesis is true.
Is p = 0.0357 significant?
Yes. A p-value of 0.0357 is less than the usual 0.05 significance level, so the result is statistically significant at the 5% level. It means a result at least as extreme as z = ±2.10 would occur about 3.57% of the time if the null hypothesis were true. It would not be significant at the stricter 1% level.
What is the difference between a one-tailed and a two-tailed p-value?
A one-tailed p-value measures one tail of the curve; a two-tailed p-value measures both. For z = 2.10, the one-tailed p-value is 0.0179 and the two-tailed p-value is 0.0357 — exactly double. Use one-tailed only when you predicted a direction before collecting data; otherwise use two-tailed.
How do I find the z-score from a p-value?
Work backwards with the inverse normal distribution: for a two-tailed p of 0.05, each tail holds 0.025, so find z with Φ(z) = 0.975, which gives z = ±1.96. For a one-tailed p of 0.05, z = 1.64. Use the reverse mode of the calculator above — enter the p-value and pick the test type.
Can a p-value be greater than 1 or negative?
No. A p-value is a probability, so it is always between 0 and 1. For example, z = 0 gives a p-value of 1.0000 two-tailed (0.5000 one-tailed) — no evidence against the null at all. A value outside 0 to 1 means an error in the calculation.
How do I interpret a p-value?
Compare it with your significance level, usually 0.05: below 0.05, the result is statistically significant; above it, it is not. Also look at the size of the effect and the sample size — a p-value says how surprising the data are under the null, not how large or important the effect is. Always report the exact value, for example p = 0.0357.
Keep going: the bell curve generator draws the full curve for any mean and standard deviation, and the normal distribution percentile visualizer shows the percentile behind any z-score. You can browse all the calculator tools on the tools page. The definitions and methods used here follow the NIST/SEMATECH e-Handbook of Statistical Methods.