
Test Score Percentiles Explained
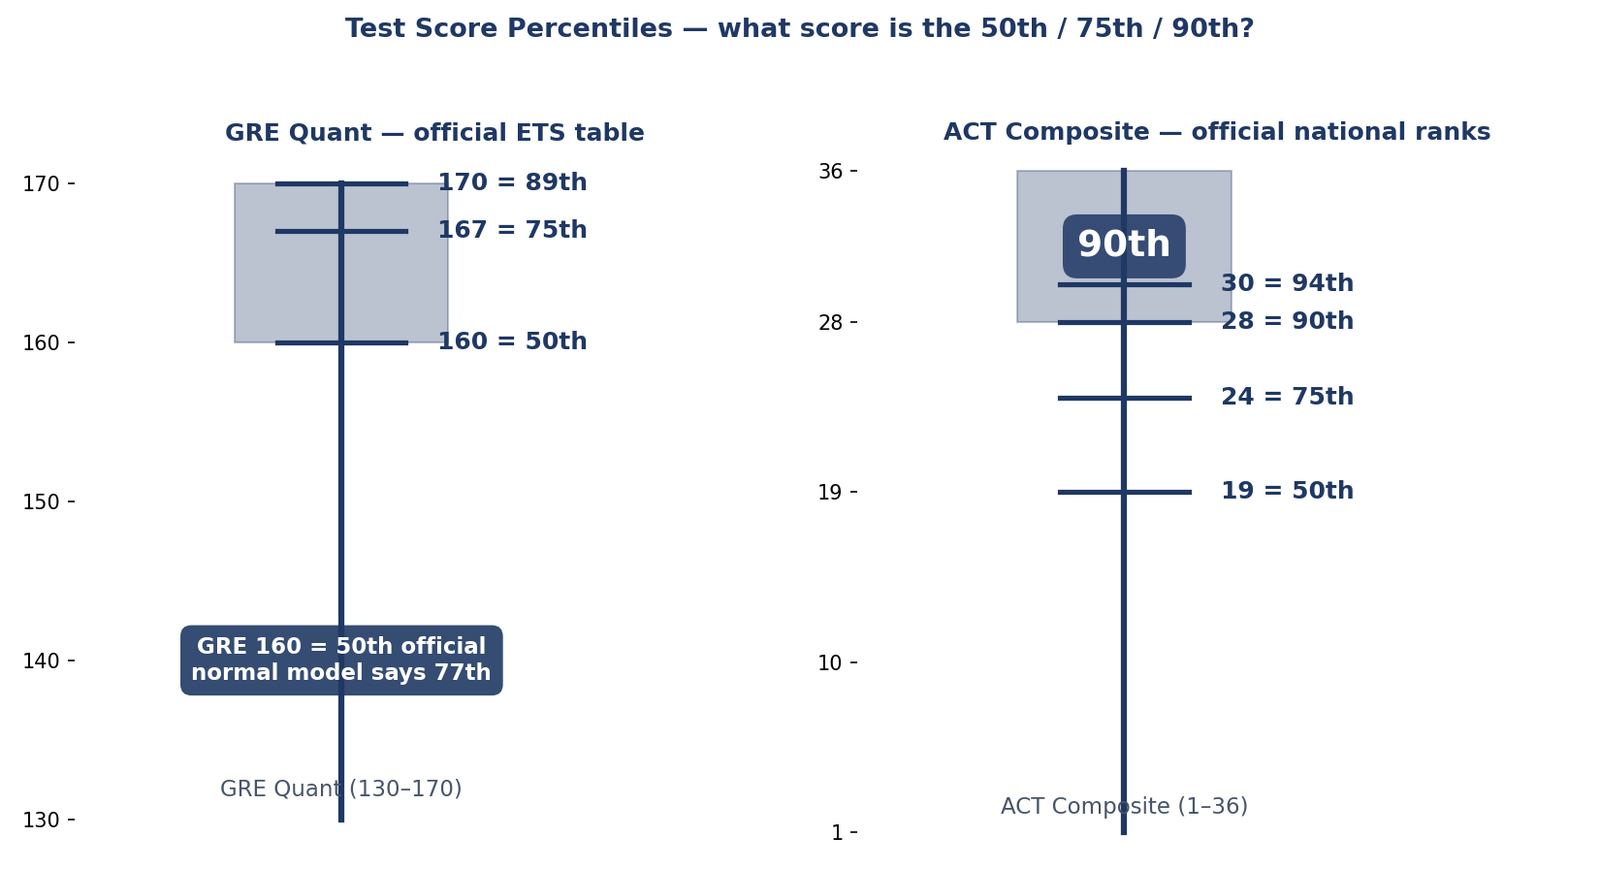
A GRE Quant 160 and an ACT 30 are both strong scores — but the percentiles they carry are not what a bell curve would predict. A GRE Quant 160 is the 50th percentile on the official ETS table, while the normal model says it should be the 77th. This guide explains what a test score percentile really means, shows the official ETS and ACT tables side by side with the normal model, and tells you what score to aim for.
A test score percentile tells you what share of test-takers scored at or below you — a GRE Quant 160 is the 50th percentile on the official ETS table, meaning half of test-takers scored lower. Percentiles are not percent correct, and they drift every year as the test-taking population changes, so always check the current official table.
What Does a Test Score Percentile Mean?
A test score percentile tells you where you stand in the group that took the same test. If your score is at the 50th percentile, half of test-takers scored at or below you and half scored above you. If it is at the 90th percentile, you scored at or above 90% of test-takers — only 10% did better. The percentile is a rank, not a mark: it says nothing about how many questions you answered correctly, only about how your score compares with everyone else’s.
That distinction is the single most common misunderstanding. A percentile of 84 does not mean you got 84% of the questions right. You could answer 84% of the questions correctly and land at the 50th percentile, if most test-takers also answered 84% correctly — or answer 60% correctly and land at the 90th percentile, if the test was hard and most people answered less. The same score can carry a different percentile on a different test, in a different year, or in a different group of test-takers, which is why the official tables below matter so much. If you want to turn a score into a percentile yourself, the test score percentile calculator does it in one step, and the guide to calculating a z-score shows the maths behind it.
Percentiles are also not the same as percentages, and the two words are easy to confuse. A percentage is a share of the total marks available — 42 out of 50 is 84%. A percentile is a share of the people who scored at or below you — the 84th percentile means 84% of test-takers scored at or below you. One is about the test paper; the other is about the people. Keep that straight and most percentile confusion disappears.
GRE Quant: The Official Table vs the Normal Model
Read this first — the model and the official table disagree by a lot. The test score percentile calculator uses a normal model for GRE Quant (mean 153, standard deviation 9.4). That model is a useful approximation, but it is not the official result. The official ETS table below is empirical — it counts real test-takers — and it always wins for a real score report. On GRE Quant the model overstates your percentile by as much as 27 points, because GRE Quant scores are heavily bunched at the top and a bell curve cannot describe that shape.
The official ETS Interpretive Data for 2026–27 covers test-takers from 1 July 2022 to 30 June 2025 (n = 790,864). Here is what it says for GRE Quant, next to what the normal model predicts:
| GRE Quant score | Official percentile (ETS) | Normal model (μ 153, σ 9.4) |
|---|---|---|
| 170 | 89th | 96.47th |
| 169 | 85th | 95.56th |
| 167 | 75th | 93.18th |
| 165 | 67th | 89.91st |
| 164 | 63rd | 87.90th |
| 163 | 60th | 85.63rd |
| 160 | 50th | 77.18th |
Two things jump out. First, no GRE Quant score reaches the 90th percentile — even a perfect 170 is the 89th percentile, because so many test-takers score near the top. Second, the model is wrong by 7 to 27 points at every score in the table. A GRE Quant 160 is the 50th percentile officially, but the model calls it the 77th — a 27-point gap.
The gap is easy to see in the z-score. A GRE Quant 160 has z = (160 − 153) / 9.4 = +0.74, and a z of +0.74 is the 77.18th percentile on a normal curve. A GRE Quant 165 has z = +1.28, the 89.91st percentile on the model — but officially it is only the 67th. The model assumes scores spread symmetrically around the mean; the real GRE Quant distribution does not. Its mean is 157.62, most test-takers cluster in the high 150s and 160s, and the left tail is long. That left skew is exactly what a normal model cannot capture, so the model flatters every score above the mean.
GRE Verbal behaves much more like a bell curve, and the two scales are worth comparing. The official Verbal table (same ETS window) reads: 170 is the 99th percentile, 165 is the 95th, 163 is the 90th, 160 is the 82nd and 157 is the 72nd, with a mean of 151.4. Analytical Writing is scored separately: an AWA of 4.0 is the 63rd percentile. And percentiles move: a GRE Quant 160 was the 61st percentile in 2023 and is the 50th now, because the test-taking population has got stronger. Always check the current ETS table for your own year. The NIST Engineering Statistics Handbook describes the normal distribution behind the model — but NIST describes the model, while the ETS table is the empirical authority for a real score.
ACT: The Official National Ranks vs the Normal Model
The ACT tells a friendlier story. Its official national ranks for 2026–27 cover graduates from 2024 to 2026, and the composite mean is 19.1. Here is the official table next to the normal model (mean 21, standard deviation 5.5):
| ACT composite | Official percentile (ACT) | Normal model (μ 21, σ 5.5) |
|---|---|---|
| 30 | 94th | 94.91st |
| 29 | 93rd | 92.71st |
| 28 | 90th | 89.85th |
| 26 | 86th | 81.84th |
| 24 | 78th | 70.73rd |
| 22 | 72nd | 57.21st |
At the top of the scale the model and the official table agree closely. An ACT 30 is the 94th percentile officially and the 94.91st on the model — a difference of less than one point. An ACT 28 is the 90th percentile on both: the model puts the 90th percentile at 28.05, which rounds to 28. The z-score shows why: an ACT 30 has z = (30 − 21) / 5.5 = +1.64, and a z of +1.64 is the 94.91st percentile on a normal curve.
Lower down, the model falls behind. A 24 is the 78th percentile officially but only the 70.73rd on the model, and a 22 is the 72nd officially but the 57.21st on the model. The ACT distribution is closer to normal than GRE Quant, so the model is useful — but it is still not a bell curve. Scores bunch in the middle, so the official table is the one to trust for a real score report.
Two details matter when you read an ACT report. First, the percentile is different for each section: at a composite of 30, English is the 93rd percentile, Math is the 95th, Reading is the 89th and Science is the 95th — the same composite can hide very different section ranks, so check the section table too. Second, the Enhanced ACT (from September 2025) changed how the composite is built: it is now the average of English, Math and Reading only, and Science is optional and not counted in the composite. If you are comparing a new score with an older one, make sure both use the same composite.
What Score Do You Need for the 75th, 90th and 99th Percentile?
Reading a table forwards tells you the percentile of a score you already have. Reading it backwards tells you the score you need for a target percentile. Here is the reverse lookup for both tests — the score that lands you at the 75th, 90th and 99th percentile, officially and on the normal model:
| Percentile | GRE Quant — official | GRE Quant — model | ACT — official | ACT — model |
|---|---|---|---|---|
| 75th | 167 | ≈ 159 | 23–24 | ≈ 25 |
| 90th | No score reaches it (170 = 89th) | ≈ 165 | 28 | ≈ 28 |
| 99th | No score reaches it | 174.87 — above the 170 scale | Top of the scale | ≈ 34 |
The reverse lookup disagrees just as much as the forward one. The 90th percentile on GRE Quant is a model score of 165.05, about 165 — but officially no GRE Quant score reaches the 90th at all, because the highest score, 170, is only the 89th. The 99th percentile is even stranger: the model puts it at 174.87, which is above the top of the 170 scale — the model extrapolates off the end of the test. On the ACT the two agree at the 90th (28 on both) and are a point apart at the 75th (official 23–24, model about 25).
What Is a Good GRE Score? What Is a Good ACT Score?
“Good” depends on where you are applying, but the percentiles give you a firm anchor. For the GRE, a Quant score of 165 or above is the floor for selective STEM programmes — officially the 67th percentile, which surprises people who expect a 165 to be a 90th-percentile score. A Verbal score of 160 or above (the 82nd percentile) is strong for most humanities and social-science programmes. For the ACT, a composite of 30 is the 94th percentile and a strong score anywhere; a 28 is the 90th percentile; a 24 is the 78th. A 30 is a good target for selective colleges, a 28 for competitive ones, and a 24 is above average nationally. Whatever your target, aim at the official percentile for your test and year — not at the number the normal model suggests.
Why Is a GRE 160 Quant Only the 50th Percentile?
Because the people taking the GRE are very strong at maths, and they bunch at the top. The GRE Quant mean is 157.62, and a large share of test-takers score in the 160s — so a 160, which looks like a high score, is only the middle of this particular group. The same 160 was the 61st percentile in 2023; it is the 50th now because the test-taking population has got stronger, not because the test got harder. A percentile is always a statement about the group, never about the score in isolation. That is also why the normal model misleads here: it assumes the group is spread symmetrically around a mean of 153, when the real group is piled up near the top with a long left tail.
What ACT Score Is the 90th Percentile?
A composite of 28. On the official ACT national ranks for 2026–27, a 28 is the 90th percentile, a 29 is the 93rd and a 30 is the 94th. The normal model agrees: it puts the 90th percentile at 28.05, which rounds to 28. If you are aiming for the top 10%, 28 is the number to beat — and a 30 puts you in the top 6%.
Do Colleges Look at Your Percentile or Your Score?
Both, for different jobs. The score is what admissions systems and cutoffs use — a programme that wants a GRE Quant of 165 or an ACT of 30 will filter on the number, not the percentile. The percentile is what gives the score its meaning: it tells a reader how your score compares with everyone who took the same test in the same period, which is what matters when a committee is comparing applicants from different years or different tests. Percentiles are also how you compare across tests — a GRE Quant 165 (67th) and an ACT 30 (94th) are very different achievements, and the percentile makes that visible. Report the score; use the percentile to judge it.
Why Do Percentiles Change from Year to Year?
Because a percentile is defined by the group, and the group changes. ETS rebuilds its GRE Interpretive Data every year from a rolling window of recent test-takers — the 2026–27 table uses 1 July 2022 to 30 June 2025 — so as the population gets stronger or weaker, the same score maps to a different percentile. ACT uses a three-year rolling average of graduates (2024–2026 for the 2026–27 ranks) for the same reason. That is why a GRE Quant 160 was the 61st percentile in 2023 and the 50th today. If you are comparing your score with someone who tested in a different year, use the table for your own year — the score is fixed, the percentile is not.
SAT Percentiles and the Concordance
This guide covers GRE and ACT only; the SAT has its own official table, and the SAT concordance lets you translate between the tests. The published concordance anchors are: a 1300 SAT is a 28 ACT, a 1400 SAT is a 31 ACT, a 1500 SAT is a 34 ACT, and a 1600 SAT is a 36 ACT; a 1390 SAT is about a 30–31 ACT. The same model-versus-official gap shows up on the SAT too: a 1200 on the normal model (mean 1028, standard deviation 213) is the 79.03rd percentile, but the official College Board table puts it at the 75th. For the full SAT table and the worked comparison, see the companion guide, SAT Percentiles Explained.
Test Score Percentiles in Excel
You can work with percentiles in Excel, but you need to know which function does which job — the two names are easy to swap. PERCENTRANK.INC takes a value and returns its percentile rank in a list: =PERCENTRANK.INC(A1:A100, 160) tells you the percentile rank of 160 within the scores in A1:A100. PERCENTILE.INC goes the other way — it takes a percentile and returns the value: =PERCENTILE.INC(A1:A100, 0.9) returns the score at the 90th percentile of the same list. And NORM.DIST gives the normal-model percentile for a score: =NORM.DIST(160, 153, 9.4, TRUE) returns 0.7718, the model’s 77.18th percentile for a GRE Quant 160. Two warnings: PERCENTRANK.INC and PERCENTILE.INC work on your list, so they only match the ETS or ACT table if your list is the whole test-taking population; and NORM.DIST gives the model value, which on GRE Quant is 27 points above the official one.
How to Convert a Score to a Percentile — and Back
You do not need a calculator for the idea — but you do need the right table. The official table always comes first; the normal model is only a check. Here is the method, step by step:
- Start with the official table, not the model. Find the ETS Interpretive Data for your GRE year, or the ACT national ranks for your graduating class. The official table is the only one that counts for a real score report.
- Find your score in the table and read across to its percentile. A GRE Quant 160 reads across to the 50th percentile; an ACT 30 reads across to the 94th. That is your official percentile — write it down.
- For the normal-model check, turn the score into a z-score. Use z = (score − mean) / SD. For a GRE Quant 160 that is (160 − 153) / 9.4 = +0.74; for an ACT 30 it is (30 − 21) / 5.5 = +1.64. The z-score guide works through the formula.
- Look up the z-score to get the model’s percentile. A z of +0.74 is the 77.18th percentile and a z of +1.64 is the 94.91st, on a normal curve. You can look it up in a z-table, use the empirical rule percentile calculator, or use
=NORM.DIST(score, mean, SD, TRUE)in Excel. - To go the other way, pick a percentile and find its z-score. The 75th percentile is z = +0.6745, the 90th is z = +1.2816 and the 99th is z = +2.3263.
- Convert the z-score back to a score. Use score = mean + z × SD, then round to the nearest whole score — and check the result against the official table, because the model can miss by a lot on a skewed test like GRE Quant. The 90th percentile on the model is 153 + 1.2816 × 9.4 = 165.05, about 165; officially, no GRE Quant score reaches the 90th at all.
Frequently Asked Questions
What does a test score percentile mean?
It tells you what share of test-takers scored at or below you. A 50th-percentile score means half of test-takers scored at or below you; a 90th-percentile score means 90% did. It is a rank among people, not a share of the marks available.
What percentile is a GRE 160 Quant?
Officially the 50th percentile on the ETS Interpretive Data for 2026–27. The normal model says the 77th, because it assumes a symmetric distribution around a mean of 153 — but the real GRE Quant distribution is bunched at the top, so the model flatters the score by 27 points. Trust the ETS table.
What percentile is a 30 on the ACT?
The 94th percentile on the official ACT national ranks for 2026–27. The normal model agrees closely: it gives the 94.91st. A 30 is a strong score — only about 6% of test-takers score higher.
What is a good GRE score?
For selective STEM programmes, a Quant score of 165 or above is the usual floor — officially the 67th percentile. A Verbal score of 160 or above (the 82nd percentile) is strong for most humanities and social-science programmes. What counts as good depends on the programme, so check its published score ranges and compare percentiles, not raw numbers.
What is a good ACT score?
A composite of 30 is the 94th percentile and a strong score anywhere; a 28 is the 90th percentile; a 24 is the 78th. A 30 is a good target for selective colleges, a 28 for competitive ones, and a 24 is above average nationally.
Percentile vs percentage — what is the difference?
A percentage is a share of the marks available: 42 out of 50 is 84%. A percentile is a share of the people: the 84th percentile means 84% of test-takers scored at or below you. You can get 84% of the questions right and still be at the 50th percentile if everyone else did just as well.
Why do percentiles change from year to year?
Because the reference group changes. ETS rebuilds the GRE table every year from a rolling window of recent test-takers, and ACT uses a three-year rolling average of graduates. As the population gets stronger or weaker, the same score maps to a different percentile — a GRE Quant 160 was the 61st percentile in 2023 and the 50th today.
How do I convert my score to a percentile / a percentile to a score?
Use the official table for your test and year: find your score and read across to its percentile, or find the percentile and read across to the score. To check the normal model, turn the score into a z-score with z = (score − mean) / SD and look up the percentile — or go the other way with score = mean + z × SD. The six steps above walk through both directions.
Check Tools
Test Score Percentile Calculator
Turn any GRE or ACT score into a percentile — or a percentile back into a score — with the normal model.
Try the Test Score Percentile Calculator →
Z-Score Calculator
Find a z-score, percentile and probability from any raw score.
Empirical Rule Percentile Calculator
Get the percentile for any value on a normal distribution, or the value for any percentile.
Try the Empirical Rule Percentile Calculator →
Bell Curve Generator
Draw the bell curve for any mean and standard deviation and shade the region you need.
Try the Bell Curve Generator →
Check Articles
SAT Percentiles Explained
The SAT companion to this guide — the official College Board table, the normal model, and the concordance.
Read SAT Percentiles Explained →
What Is a Raw Score?
The original, untransformed measurement — how a raw score becomes a z-score and a percentile.
What Is a Bell Curve?
The normal distribution behind every percentile in this guide, with the 68-95-99.7 rule.
How to Calculate a Z-Score
Turn any value into a z-score with the (x − μ) / σ formula, step by step.
Read How to Calculate a Z-Score →
IQ Bell Curve Explained
Why IQ is centred on 100, what the Wechsler bands mean, and how rare your score really is.