
Probability to Z-Score Approximation Tool
Convert probability values to corresponding z-scores for normal distributions
Probability to Z-Score Approximation Tool
Enter a probability value and select the tail type to find the corresponding z-score
Enter the probability value and tail direction:
Results:
Z-Score: 1.6449
Interpretation: For a right-tailed probability of 0.05 (5%), the z-score is approximately 1.6449
How to Use:
- • Enter a probability value between 0 and 1
- • Select the appropriate tail type
- • Click "Calculate Z-Score" to get the result
- • The chart will show the distribution with the highlighted area
Use this probability to z-score calculator to convert a probability into a z-score in seconds: a cumulative probability of 0.95 gives z ≈ 1.645, a probability of 0.975 gives z ≈ 1.96, and a right-tail probability of 0.05 gives z ≈ 1.6449. Enter any probability between 0 and 1, choose the tail type, and read off the inverse normal value.
What Is a Z-Score in Probability?
A z-score measures how many standard deviations a value lies from the mean of a distribution. For the standard normal distribution, the mean is 0 and the standard deviation is 1, so a z-score of 1.96 sits 1.96 standard deviations above the mean, and a z-score of −1.96 sits the same distance below it. Because any normal distribution can be standardised in this way, z-scores let you compare results from different tests, datasets and scales on one common scale.
Converting a probability to a z-score works in the opposite direction. Normally you start with a value, turn it into a z-score and look up the probability below it. Here you start with the probability — the area under the bell curve, also called the cumulative probability — and ask which z-score leaves exactly that much area to its left. That is the inverse normal distribution, also called the inverse CDF or the quantile function. The NIST/SEMATECH e-Handbook of Statistical Methods defines the standard normal distribution and its cumulative distribution function, which this calculator inverts numerically.
How to Convert Probability to Z-Score
Converting a probability to a z-score means finding the z-score whose cumulative probability — the area under the curve to its left — equals your number. That is the inverse cumulative distribution function, usually looked up in a z-table but done instantly by this tool.
- Decide which probability you have — left tail (the share below), right tail (the share above), two tails, or the middle area between two symmetric z-scores.
- Type the probability as a decimal between 0 and 1, for example 0.95 for 95%, and choose the matching probability type.
- Click Calculate Z-Score and read the z-score, given to four decimal places.
- Check the sign: a cumulative probability above 0.5 gives a positive z-score and below 0.5 a negative one. A right-tail probability of 0.05 is the same cut-off as a cumulative probability of 0.95, so both give z ≈ 1.6449.
Common values to check against:
| Cumulative probability | Z-score | Percentile |
|---|---|---|
| 0.90 | 1.2816 | 90th |
| 0.95 | 1.6449 | 95th |
| 0.975 | 1.9600 | 97.5th |
| 0.99 | 2.3263 | 99th |
| 0.995 | 2.5758 | 99.5th |
| 0.999 | 3.0902 | 99.9th |
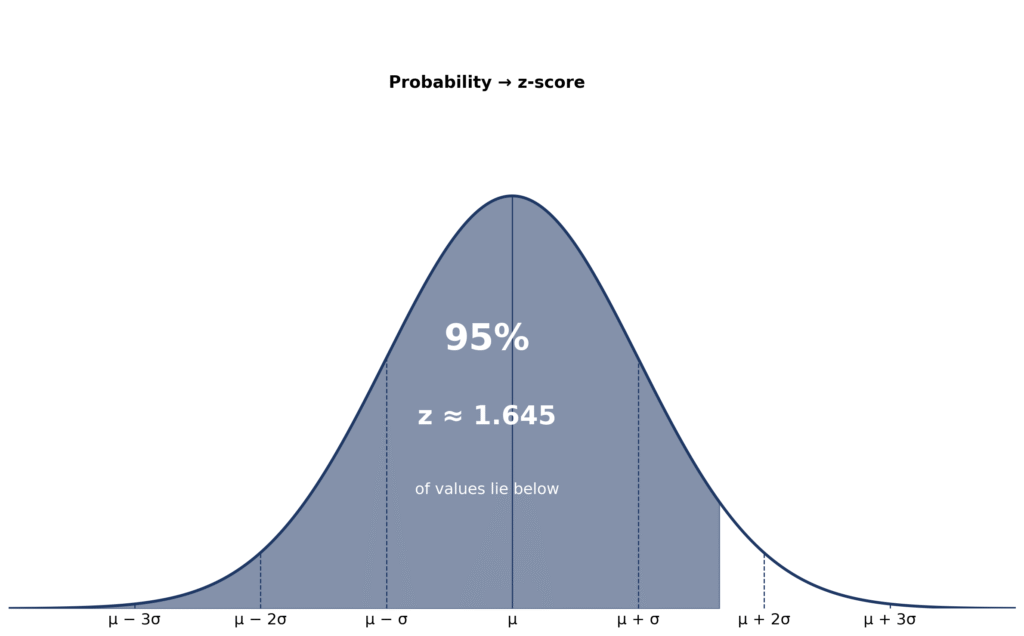
Worked example — 95% below: enter P = 0.95 with Left Tail selected. The output is z ≈ 1.645, which means 95% of values lie below this z-score and 5% above it.
Worked example — top 5% of test takers: a right-tail probability of 0.05 gives z ≈ 1.6449. On a test scored with mean 100 and standard deviation 15, the cut-off is 100 + 1.6449 × 15 ≈ 124.7, so roughly 125. If you need the opposite direction — a probability from a z-score or a value — use the tail-probability calculator instead.
Real-Life Applications
The probability to z-score calculator is widely used wherever a cut-off has to be set from a probability:
- Standardised testing: a university that admits the top 5% of applicants sets its cut-off at z ≈ 1.6449. On a test scored with mean 100 and standard deviation 15, that is a score of about 125.
- Quality control: a factory that allows at most 2.5% of parts above a size limit uses a right-tail probability of 0.025, giving z ≈ 1.96, so the limit sits 1.96 standard deviations above the mean.
- Psychological research: probabilities from IQ or behavioural data are mapped to z-scores — a score at the 97.7th percentile has z ≈ 2.
- Finance: risk is assessed by finding the z-score for extreme probabilities, for example a 1% value-at-risk level, which is a left-tail probability of 0.01 and z ≈ −2.3263.
For other probability questions, browse all the calculators on the tools page.
Tool Features & How It Works
The approximate z-score calculator is deliberately simple:
- Inputs: a probability between 0 and 1, and a probability type — left tail, right tail, two tails or middle. There is no raw-score, mean or standard-deviation input: this tool works with probabilities only, so you never need a dataset to use it.
- Outputs: the z-score to four decimal places, a one-sentence interpretation, and the bell-curve chart for the probability you entered.
- Accuracy: the inverse normal approximation is accurate to four decimal places for most practical probabilities.
- Limitations: it assumes the standard normal distribution, so it is not suitable for skewed or non-normal data, and probabilities extremely close to 0 or 1 fall outside the tool’s useful range.
How it works: enter a probability (for example, 0.95), choose the tail, and the tool applies the inverse cumulative distribution function. For a probability from a z-score instead, use the tail-probability calculator.
Probability vs Percentile vs Z-Score
These three ideas describe the same bell curve in different words, so it helps to keep them apart:
- Probability is the area under the curve — for example, 0.95 for the 95% of data below a z-score.
- Percentile is the rank of a value — the 95th percentile means 95% of the data lies below it. The percentile is simply the probability multiplied by 100.
- Z-score is the position in standard deviations from the mean — it links probability and percentile, since z = 1.645 marks the 95th percentile.
This page does probability → z-score, which is the inverse direction: given a probability, find the z-score. If you already have a z-score and want its percentile, use the z-score to percentile converter; if you have a value and want the probability, see the probability finder. For percentile calculations, try our percentile calculator. If you need the probability inside an arbitrary zone rather than a tail, use the custom-zone calculator.
What Is the Difference Between a Left-Tail and a Right-Tail Probability?
A left-tail probability is the area under the bell curve to the left of a z-score, written P(Z ≤ z); it is the same thing as a cumulative probability, and as a decimal it is the percentile divided by 100. A right-tail probability is the area to the right, P(Z ≥ z), and the two always add to 1. So a right-tail probability of 0.05 is the same cut-off as a left-tail probability of 0.95, which is why the same number, 1.6449, answers both questions. When you use this calculator, pick Left Tail if your probability is the share below the cut-off and Right Tail if it is the share above it. If you need a probability from a z-score instead, use the tail-probability calculator.
What Is the Z-Score for 95 Percent?
The z-score for 95 percent depends on what the 95% means. If 95% of values lie below the cut-off, the z-score is 1.6449 — that is the 95th percentile. If 95% lies in the middle, between two symmetric cut-offs, each cut-off is z ≈ ±1.96, the figure behind the familiar 95% confidence interval. And if 95% lies above the cut-off, the z-score is −1.6449. The three answers are different, so always say which 95% you mean before you look the value up.
How Do I Convert Probability to Z-Score?
To convert a probability to a z-score, first decide whether the probability is cumulative (left tail), right tail, two-tail or middle. Then find the z-score whose cumulative probability equals your number: use an inverse normal table, a spreadsheet’s NORM.S.INV function, or this calculator. For example, enter 0.975 with Left Tail selected and you get z ≈ 1.96. To do it by hand with a z-table, look for the probability closest to yours in the body of the table and read off the row and column that give the z-score.
FAQs
Use a z-table to find the z-score where the cumulative probability matches your input — for example, P = 0.95 gives z ≈ 1.645. A z-table lists cumulative probabilities in the body of the table, with z-scores in the row and column headings. For speed and exact four-decimal values, use this calculator instead.
The z-score for a cumulative probability of 0.95 is 1.6449, which is the 95th percentile — 95% of values lie below it and 5% above it. This is also the cut-off for a right-tail probability of 0.05.
Yes. It inverts the standard normal distribution — mean 0, standard deviation 1 — which is the same distribution a z-table is built from. The values it returns match a standard z-table and the critical-values table on this page to four decimal places.
No. This calculator assumes the standard normal distribution. If your data is skewed or follows a different distribution, standardise it first, or use a method suited to that distribution — the z-scores from this tool will not be valid otherwise.
The z-score for a cumulative probability of 0.975 is 1.96, the 97.5th percentile. It is the value used for 95% confidence intervals and for two-tail tests at the 5% level.
A right-tail probability of 0.05 gives z ≈ 1.6449, the same cut-off as a cumulative probability of 0.95. It is the tool’s default example: 5% of the distribution lies above z = 1.6449 and 95% below it.
Divide the percentile by 100 to get the cumulative probability, then convert that probability to a z-score. For example, the 90th percentile is a probability of 0.90, giving z ≈ 1.2816, and the 97.5th percentile is 0.975, giving z ≈ 1.96. This calculator does the conversion in one step — enter the probability as a decimal and choose Left Tail.
The inverse normal distribution is the function that turns a probability back into a z-score — the inverse of the cumulative distribution function, also called the inverse CDF or quantile function. Given a cumulative probability, it returns the z-score that leaves exactly that area to its left. This calculator evaluates it numerically using an approximation to the standard normal CDF.
Conclusion
The probability to z-score calculator turns a probability into a z-score in seconds, so students, analysts and researchers can find cut-offs for cumulative, right-tail, two-tail and middle probabilities without a z-table. With the critical values on this page — 0.95 giving z ≈ 1.6449 and 0.975 giving z ≈ 1.96 — and the z-score to percentile converter for the reverse direction, you have both directions of the inverse normal distribution covered. To go further, browse all the calculators on the tools page, read the probability guide, or try the tail-probability calculator and the custom-zone calculator.
Next steps
📘
● Live
How to Calculate Z-Score
Learn the step-by-step method behind any z-score.
Calculator
Try Calculator →
🧮
● Live
Z-Score Calculator
Find the z-score for a value, mean and standard deviation.
Calculator
Try Calculator →
🧮
● Live
Normal Distribution Calculator
Get exact probabilities for a normal distribution.
Calculator
Try Calculator →
More Tools to Explore
Empirical Rule Percentile Calculator
Quickly estimate percentiles in a normal distribution using the 68-95-99.7 rule. Input mean, standard deviation, and a score to find its percentile rank.
Try CalculatorZ-Score to Percentile Converter
Convert a z-score to a percentile in a normal distribution. Enter your z-score to see the percentage of data below it, ideal for test scores or analytics.
Try CalculatorPercentile Rank Calculator
Enter a comma-separated dataset and a target value to find where that value ranks as a percentile.
Try CalculatorNormal Distribution to Percentile Visualizer
Visualize your score on a bell curve with shaded percentile areas. Enter mean, standard deviation, and a score to see its rank in a normal distribution.
Try Calculator