
What Is the Coefficient of Variation?
The coefficient of variation (CV) turns a standard deviation into a percentage of the mean, so you can compare the spread of two datasets even when they live on completely different scales.
The coefficient of variation fixes a blind spot in the standard deviation: a standard deviation of 5 minutes means one thing for a 20-minute pizza delivery and something very different for a 200-minute train journey. Divide the standard deviation by the mean and you get a unit-free percentage that lets you compare the variability of two things measured in different units — or on very different scales.
The coefficient of variation (CV) is the standard deviation divided by the mean, usually as a percentage: CV = SD ÷ mean × 100%. It measures relative spread, so it can compare variability between datasets with different units or very different means.
What Is the Coefficient of Variation?
The coefficient of variation (CV) is the standard deviation divided by the mean, expressed as a percentage. It is also called the relative standard deviation (RSD). Because the units cancel — the standard deviation and the mean are measured in the same units — CV is a unitless number, so you can compare the variability of a dataset measured in dollars with one measured in minutes, or a small dataset with a huge one. Run the numbers for your own data with the coefficient of variation calculator.
CV = (standard deviation ÷ mean) × 100%
That unitless quality is the whole point. A standard deviation is tied to its units: you cannot say whether an SD of 5 is large or small until you know the mean it belongs to. CV answers that question in one number. The NIST Dataplot reference defines the coefficient of variation as the ratio of the standard deviation to the mean, and it is the standard way to compare relative variability.
CV only makes sense for data on a ratio scale — measurements with a true zero, like length, weight, time or money. It does not work for interval scales such as temperatures in Celsius, where zero is arbitrary, and it needs a mean that is not zero or close to it, because dividing by a tiny mean makes CV explode. Both limits are covered in the “When the Coefficient of Variation Breaks” section below.
How to Calculate the Coefficient of Variation
Calculating CV takes three steps: find the mean, find the standard deviation, then divide and multiply by 100. The only choice you have to make is whether to use the sample standard deviation or the population standard deviation — and that choice changes the answer, as the next section shows.
1. Work out the mean of your data.
2. Work out the standard deviation. If you need a refresher, see how to calculate standard deviation.
3. Divide the standard deviation by the mean and multiply by 100: CV = (SD ÷ mean) × 100%.
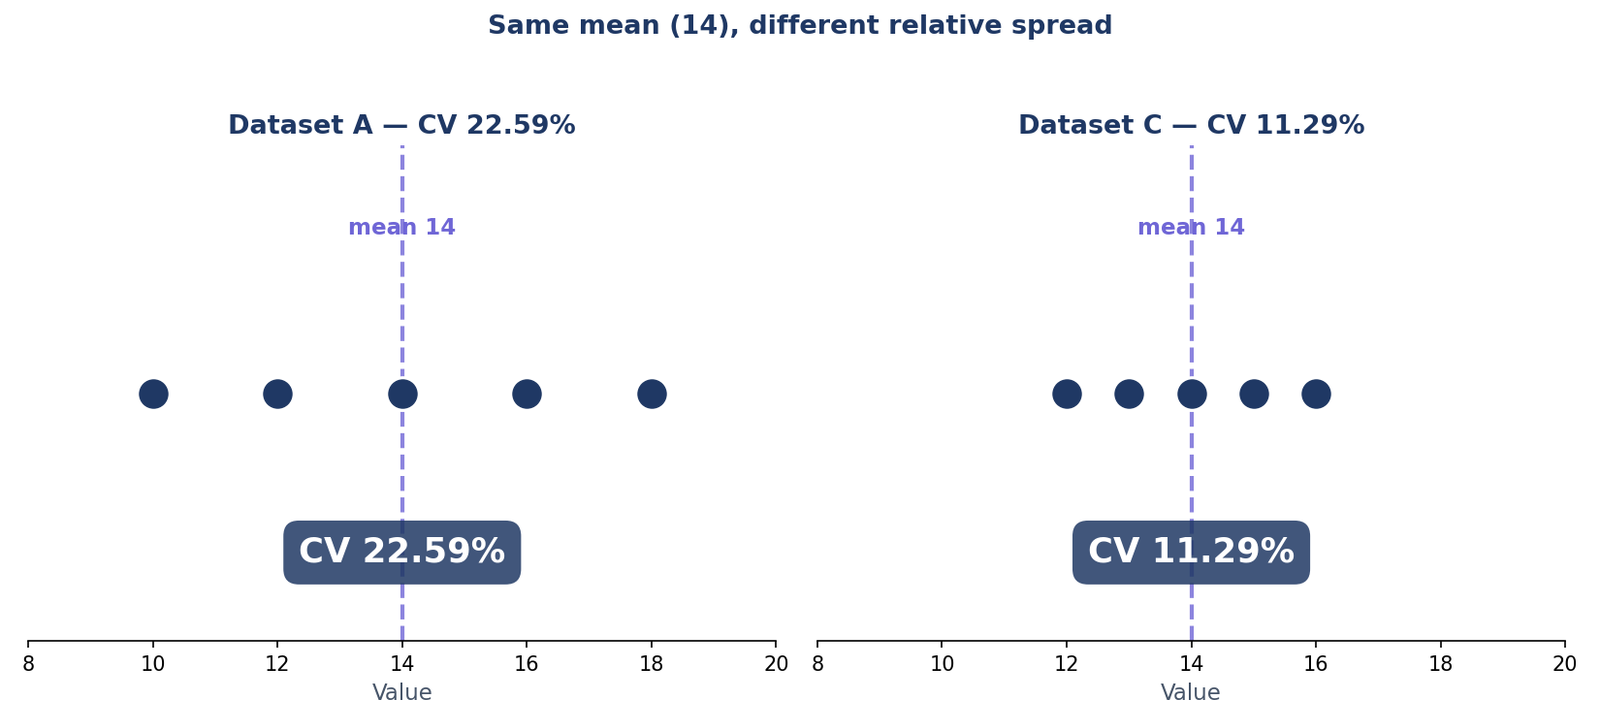
Take dataset A: 10, 12, 14, 16, 18. The mean is 14. The sample standard deviation is 3.16, so the sample CV is (3.16 ÷ 14) × 100% = 22.59%. The population standard deviation is 2.83, so the population CV is (2.83 ÷ 14) × 100% = 20.20%. The NIST e-Handbook defines the standard deviation as the square root of the variance, which is why the two versions differ: the sample version divides by n − 1 and the population version divides by n.
Sample CV vs Population CV — Which One Do I Report?
There are two coefficients of variation for any dataset, because there are two standard deviations. The sample CV uses the sample standard deviation (dividing by n − 1); the population CV uses the population standard deviation (dividing by n). The sample version is always a little larger, because dividing by n − 1 gives a larger SD. Report the one that matches your data: sample CV when your numbers are a sample, population CV when you have the whole population. For the difference between the two standard deviations, see population vs sample standard deviation.
| Dataset | Mean | Sample SD | Sample CV | Population SD | Population CV | Band |
|---|---|---|---|---|---|---|
| A: 10, 12, 14, 16, 18 | 14 | 3.16 | 22.59% | 2.83 | 20.20% | High |
| B: 100, 110, 120, 130, 140 | 120 | 15.81 | 13.18% | 14.14 | 11.79% | Moderate |
Both CVs fall when you switch from sample to population — but the band verdict can change too. The boundary case is the dataset 80, 90, 100, 110, 120, whose mean is 100: its sample CV is 15.81% and the tool grades it High, while its population CV is 14.14% and the tool grades it Moderate. Same data, same mean, same spread — two different verdicts, because the sample and population standard deviations straddle the 15% boundary. Always say which CV you are reporting.
Worked Example: Two Datasets, One Winner
Dataset A and dataset B make the point better than any definition. A is 10, 12, 14, 16, 18 (mean 14, sample SD 3.16, sample CV 22.59%, band High). B is 100, 110, 120, 130, 140 (mean 120, sample SD 15.81, sample CV 13.18%, band Moderate). B’s absolute spread is five times A’s — its standard deviation is 15.81 against 3.16 — yet B is the steadier dataset in relative terms, because its values sit closer to its own mean. That is exactly what CV is for: it stops the bigger numbers from winning by default. Compare two datasets with the calculator and see both CVs side by side.
Two more quick comparisons. The dataset 2, 4, 6, 8, 10 has mean 6 and sample SD 3.16 — the same SD as dataset A — but its CV is 52.70% (population 47.14%), because the mean is so much smaller. And a fixed SD of 4 gives a CV of 20% when the mean is 20, but only 2% when the mean is 200. The spread never changed; only the scale did. If you want a different way to measure spread that keeps the units, try the mean absolute deviation calculator.
When the Coefficient of Variation Breaks
CV is a ratio, and ratios misbehave when the denominator is zero, negative or meaningless. Three cases break it outright.
A negative mean flips the sign. Take −10, −12, −14: the mean is −12 and the standard deviation is 2.00, so CV = (2.00 ÷ −12) × 100% = −16.67%. A negative coefficient of variation has no interpretation — the spread is not negative, the mean is. The minus sign carries no information, so take the absolute value or, better, do not use CV for data with a negative mean at all.
A constant dataset has a CV of 0. For 100, 100, 100 the standard deviation is 0, so CV = (0 ÷ 100) × 100% = 0%. That is correct — there is no variation at all — but it also shows that CV cannot distinguish a constant dataset from one that merely has a tiny spread relative to a huge mean.
Temperatures in Celsius break CV. Celsius is an interval scale: 0°C is an arbitrary point, not a true zero. A dataset of temperatures with a mean near 0°C gives an enormous or meaningless CV, and converting the same temperatures to Fahrenheit changes the CV — which proves the number was never about the data. CV needs a ratio scale with a true zero. For what the centre of a distribution means, and how its shape is described, see mean vs median vs mode and what is skewness and kurtosis.
Coefficient of variation vs standard deviation — when do I use which?
Use the standard deviation when you are comparing datasets measured in the same units on a similar scale — it keeps the original units, so the answer is directly interpretable (a standard deviation of 5 minutes is 5 minutes). Use the coefficient of variation when the units differ or the scales are far apart — it strips the units away so the comparison is fair. A good rule: if you would not compare the means directly, do not compare the standard deviations directly either; compare the CVs. Work out the standard deviation first with the standard deviation calculator, then divide by the mean.
What is a good coefficient of variation value?
There is no universal “good” CV — it depends on the field. In laboratory work, a CV under 5% is often considered excellent and 10–15% acceptable; in finance, a CV of 20% can be normal for a volatile asset; in manufacturing, anything above 10% usually triggers an investigation. The calculator on this site grades CVs as Low, Moderate or High, and dataset A (22.59%) lands in High while dataset B (13.18%) lands in Moderate — a useful starting point, but always judge the number against what is normal for your own measurements. A concrete anchor: a pizza delivery service with a mean delivery time of 20 minutes and a standard deviation of 5 minutes has a CV of 25% — a quarter of the mean, which most customers would call unreliable. Run your own numbers through the statistics calculator to see the mean and SD together.
When should you never use the coefficient of variation?
Never use CV when the mean is zero or close to zero (the ratio explodes), when the mean is negative (the sign is meaningless, as shown above), when the data is on an interval scale such as Celsius or Fahrenheit (no true zero), or when the data contains both positive and negative values that cancel out to a small mean. In those cases, report the standard deviation on its own, or use a measure that does not divide by the mean. The distinction between the standard error and the standard deviation matters here too: neither is a substitute for CV, but confusing them is the most common way to report the wrong kind of spread. When you need the precision of a mean rather than the spread of the data, use the standard error calculator.
Coefficient of Variation in Excel
Excel has no built-in function for the coefficient of variation — you build it from two functions. For a sample, use =STDEV.S(range)/AVERAGE(range) and format the result as a percentage; for a population, use =STDEV.P(range)/AVERAGE(range). STDEV.S is the sample standard deviation (dividing by n − 1) and STDEV.P is the population standard deviation (dividing by n), so the two formulas give you the sample CV and the population CV respectively. For dataset A in cells A1:A5, =STDEV.S(A1:A5)/AVERAGE(A1:A5) returns 22.59% and =STDEV.P(A1:A5)/AVERAGE(A1:A5) returns 20.20% — the same two numbers as the worked example above.
If your mean is in one cell and your standard deviation in another, the same idea applies: divide the SD cell by the mean cell and format as a percentage. Just remember the two rules from this guide: use the sample version for samples, and do not use CV at all when the mean is zero, negative or on an interval scale.
Frequently Asked Questions
What is the coefficient of variation?
The coefficient of variation (CV) is the standard deviation divided by the mean, expressed as a percentage: CV = (SD ÷ mean) × 100%. It measures relative variability, so it can compare datasets with different units or very different means.
How do you calculate the coefficient of variation?
Find the mean, find the standard deviation, then divide the standard deviation by the mean and multiply by 100. For a sample use the sample standard deviation (STDEV.S in Excel); for a population use the population standard deviation (STDEV.P).
What is a good CV value?
It depends on the field. In lab work a CV under 5% is excellent and 10–15% is acceptable; in finance 20% can be normal. As a rough guide, a CV under 10% is low, 10–20% is moderate and above 20% is high — but always judge it against what is normal for your own measurements.
CV vs standard deviation — when do I use which?
Use the standard deviation when datasets share the same units and a similar scale, because it keeps the original units. Use the coefficient of variation when the units differ or the scales are far apart, because it removes the units and makes the comparison fair.
Can the coefficient of variation be negative?
Yes, when the mean is negative: a mean of −12 with a standard deviation of 2.00 gives a CV of −16.67%. The minus sign carries no meaning about the spread, so take the absolute value or do not use CV for data with a negative mean.
Why is CV meaningless for temperatures in Celsius?
Because Celsius is an interval scale with no true zero: 0°C is an arbitrary point. A mean near 0°C makes the CV enormous or meaningless, and converting the same temperatures to Fahrenheit changes the CV. CV needs a ratio scale with a true zero.
Sample CV vs population CV — which one do I report?
Report the sample CV when your data is a sample and the population CV when you have the whole population. The sample CV is always a little larger. For the same dataset the two can even land in different bands — for 80, 90, 100, 110, 120 the sample CV is 15.81% (High) and the population CV is 14.14% (Moderate).
What does a CV of 0 mean?
It means there is no variation at all: every value is the same, so the standard deviation is 0. For 100, 100, 100 the CV is (0 ÷ 100) × 100% = 0%.
Check Tools
Try the numbers from this guide with the site’s free calculators:
Coefficient of Variation Calculator
Enter your data and get the sample and population CV, the band verdict and a comparison of two datasets.
Try the coefficient of variation calculator →
Standard Deviation Calculator
Find the SD your CV depends on, for a sample or a population.
Try the Standard Deviation Calculator →
Statistics Calculator
Mean, median, mode, SD and more for any dataset, in one place.
Try the Statistics Calculator →
Explore All Statistical Tools
See every calculator on the site in one place.
Browse all our statistical tools →
Check Articles
Go deeper with these guides:
How to Calculate Standard Deviation
Work out SD step by step, the number every CV depends on.
Read the guide →
Population vs Sample Standard Deviation
When to divide by n and when to divide by n − 1, and why it matters.
Read the guide →
Mean vs Median vs Mode
Which centre to use, and what each one tells you about your data.
Read the guide →
What Is Skewness and Kurtosis
How the shape of a distribution affects what a single spread number can say.
Read the guide →