
What Is a Raw Score?
If you have ever asked what is a raw score in statistics, the short answer is the number you actually earned — 86 points on a test, 130 on an IQ scale, 42 out of 50 on a quiz. It is the simplest number in statistics, and also the most misunderstood: on its own, it tells you almost nothing about how well you did.
A raw score is the original, untransformed measurement — the points you actually earned, in the test’s own units. It becomes comparable across tests only when converted to a z-score with z = (X − μ) / σ. A raw score of 130 on an IQ test (mean 100, SD 15) is z = +2, the 97.72nd percentile.
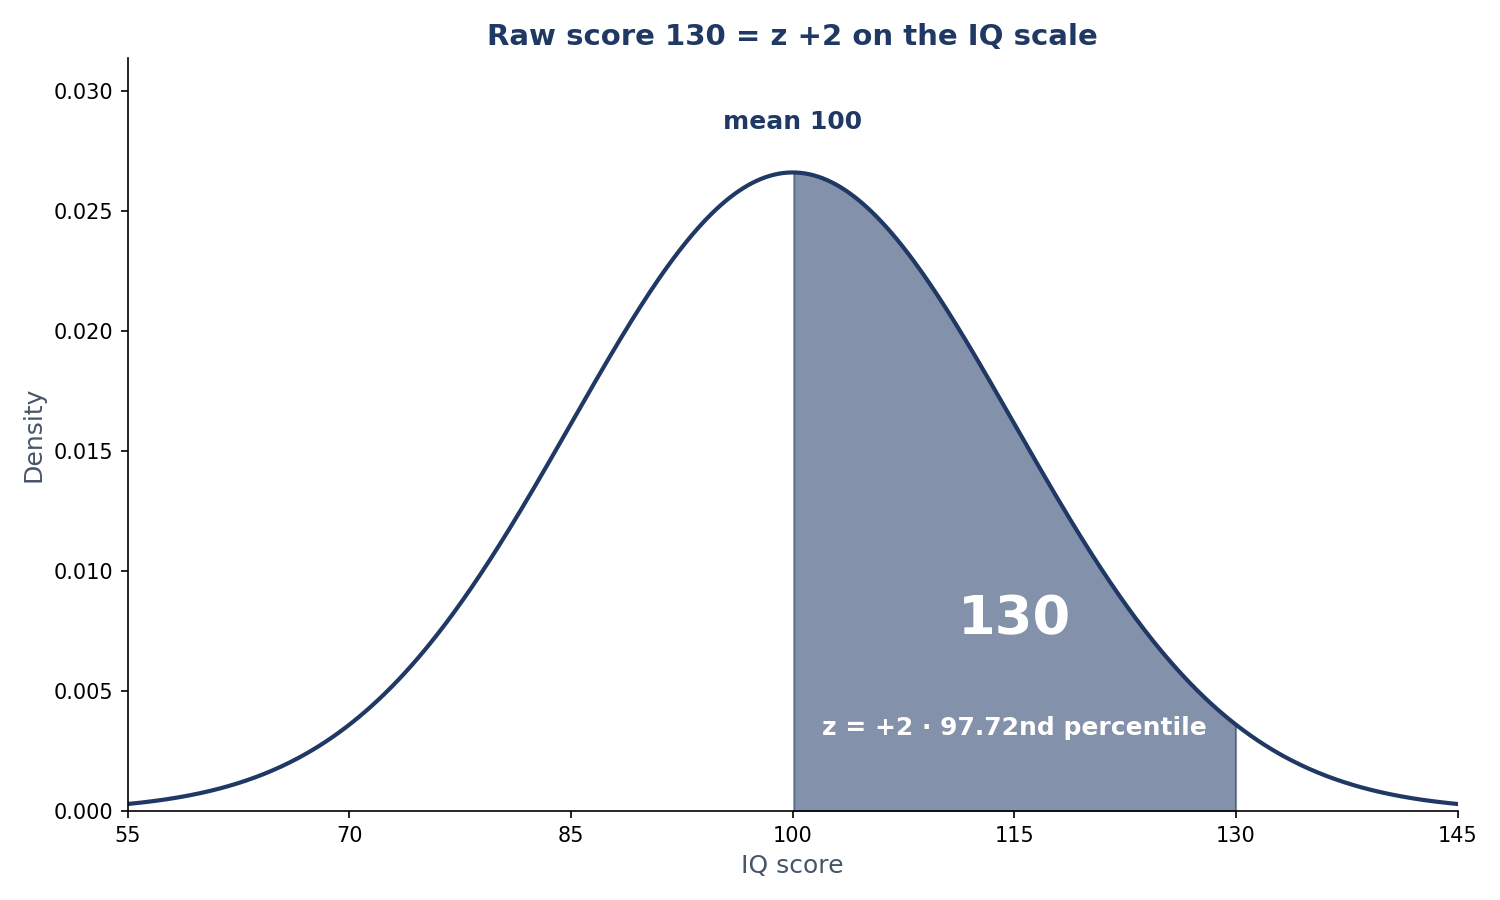
What Is a Raw Score in Statistics?
A raw score is the original, untransformed result of a measurement — the number recorded before any standardisation, scaling or ranking is applied. If a student answers 42 questions correctly out of 50, the raw score is 42. If an IQ test reports 130, the raw score is 130 points on that test’s scale. If a runner finishes a race in 58.4 seconds, the raw score is 58.4 seconds. That is the whole answer to what is a raw score in statistics: the number you measured, before you did anything to it.
The key word is original. A raw score is expressed in the test’s own units — points, seconds, millimetres, dollars — and it has not been adjusted for the difficulty of the test, the group who took it, or the scale it was measured on. That is both its strength and its weakness: it is the honest number, but on its own it cannot tell you whether the result is good, bad or average.
A raw score of 86 sounds good. But 86 on a test whose class average was 80 with a standard deviation of 5 is a strong result, while 86 on a test whose average was 92 is below average. The raw score alone cannot tell you which it is. To find out, you have to convert it — and the first step is the z-score. Our raw score calculator does the conversion for you, but the arithmetic is simple enough to do by hand, as the next section shows.
Raw scores appear everywhere: exam marks, IQ points, reaction times, heights, weights, sales figures and temperatures. Whenever you see a number that was measured directly and not yet compared with a group, you are looking at a raw score.
The Raw Score Formula
The formula that turns a z-score back into a raw score is:
X = Z × SD + Mean
X is the raw score, Z is the z-score, SD is the standard deviation and Mean is the average of the group. The formula also works in the other direction. To go from a raw score to a z-score, use the inverse: z = (X − μ) / σ, where μ is the mean and σ is the standard deviation. The two formulas are the same relationship, read in opposite directions — one standardises, the other un-standardises.
Worked example on the IQ scale (mean 100, SD 15): a z-score of +2 gives X = 2 × 15 + 100 = 130. A z-score of +1.5 gives X = 1.5 × 15 + 100 = 122.5. A z-score of −1 gives X = −1 × 15 + 100 = 85. And a raw score of 130 converts back to z = (130 − 100) / 15 = +2. Try the same arithmetic in our raw score calculator: enter a z-score of 2, a mean of 100 and a standard deviation of 15, and it returns 130.
The formula is pure arithmetic: it works for any numbers you feed it. But the percentile it implies — that 130 sits at the 97.72nd percentile — only holds when the scores follow a normal distribution. For skewed data the raw score is still exact; only the percentile reading needs care. The guide to how to calculate a z-score walks through the inverse step, and what a bell curve is explains the normal distribution the percentiles come from.
How to Find a Raw Score from a Z-Score
Finding a raw score from a z-score is the most common raw-score calculation, and it takes four steps. Follow them in order and you cannot go wrong:
- Find the mean (μ). This is the average of the group the z-score was calculated against — 100 for IQ tests, or the class average for a school test.
- Find the standard deviation (σ). This is the spread of the group’s scores — 15 for IQ tests, or the standard deviation your teacher reports for the test.
- Take the z-score (Z). This is the number of standard deviations above or below the mean — +2, +1.5, −1, or whatever your z-score is.
- Multiply and add. Multiply the z-score by the standard deviation, then add the mean: X = Z × SD + Mean.
Worked examples on the IQ scale (mean 100, SD 15):
| Z-score | Calculation | Raw score | Percentile |
|---|---|---|---|
| +2 | 2 × 15 + 100 | 130 | 97.72nd |
| +1.5 | 1.5 × 15 + 100 | 122.5 | 93.32nd |
| −1 | −1 × 15 + 100 | 85 | 15.87th |
The same four steps work on any scale. On a class test with a mean of 72 and a standard deviation of 6, a z-score of +1.5 gives X = 1.5 × 6 + 72 = 81 (the 93.32nd percentile), and a z-score of −2 gives X = −2 × 6 + 72 = 60 (the 2.28th percentile). If you would rather not do it by hand, the raw score calculator runs the same four steps instantly — and the z-score calculator runs them in reverse.
How to Find a Raw Score from a Percentile
Percentiles run the other way: you start from a position in the group and work back to a score. A student at the 90th percentile scored better than 90% of the group — but what raw score is that? The route has three steps: percentile → z-score → raw score. The middle step needs a z-table (or the empirical rule percentile calculator), because percentiles do not convert to raw scores directly.
The reverse chain, worked on the IQ scale (mean 100, SD 15): the 90th percentile corresponds to z = 1.2816. Plug it into the formula: X = 1.2816 × 15 + 100 = 119.22. So a raw score of about 119 is the 90th percentile on an IQ test. The 75th percentile is z = 0.6745, giving X = 0.6745 × 15 + 100 = 110.12. And the 84th percentile is close to z = +1.0, which is why a useful rule of thumb says the 84th percentile sits about one standard deviation above the mean.
| Percentile | Z-score | Raw score (IQ scale) |
|---|---|---|
| 50th | 0 | 100 |
| 75th | 0.6745 | 110.12 |
| 84th | ≈ 1.00 | ≈ 115 |
| 90th | 1.2816 | 119.22 |
| 97.72nd | 2.00 | 130 |
Notice the pattern: the 50th percentile is always the mean (z = 0), because half the group sits below the average. The test score percentile calculator runs this chain for any test, and the guide to what a bell curve is explains why the z-table works. The normal distribution behind the z-table is documented in the NIST Engineering Statistics Handbook. One warning: this chain assumes the scores are roughly normal. On a skewed test the percentile itself is still exact (it is just a ranking), but the z-score step — and therefore the raw score it implies — is only an approximation.
Same Student, Two Tests: Why Raw Scores Can’t Be Compared Directly
Raw scores from different tests cannot be compared directly, because each test has its own mean and standard deviation. The same student can earn two very different raw scores on two tests and be at exactly the same position in both groups — or earn a higher raw score on one test and still be worse off. The z-score is what makes the comparison fair.
Take one student who sat two tests. On Test A the class mean was 80 and the standard deviation was 5; the student scored 86. On Test B the mean was 60 and the standard deviation was 10; the student scored 72. Convert both: Test A gives z = (86 − 80) / 5 = +1.2, and Test B gives z = (72 − 60) / 10 = +1.2. The same z-score, the same 88.49th percentile — the student is at exactly the same standing in both classes, even though the raw scores (86 and 72) look nothing alike. The z-score calculator does this conversion in one step.
Now the trap. The same student sits two different tests and scores 84 on Test A (mean 80, SD 5) and 70 on Test B (mean 60, SD 10). The raw score on Test A is higher — 84 beats 70. But convert them: Test A gives z = (84 − 80) / 5 = +0.8, the 78.81st percentile; Test B gives z = (70 − 60) / 10 = +1.0, the 84.13th percentile. The student did better on Test B, the test with the lower raw score. The raw ranking and the z ranking point in opposite directions — and the z ranking is the honest one, because it accounts for how hard each test was and how spread out the class was.
| Test | Mean | SD | Raw score | Z-score | Percentile |
|---|---|---|---|---|---|
| A | 80 | 5 | 86 | +1.2 | 88.49th |
| B | 60 | 10 | 72 | +1.2 | 88.49th |
| A | 80 | 5 | 84 | +0.8 | 78.81st |
| B | 60 | 10 | 70 | +1.0 | 84.13th |
This is why universities and employers standardise scores instead of comparing raw marks: a raw score only means something inside its own test. The guide to how to calculate a z-score shows the conversion, and the IQ bell curve calculator shows the same idea on the IQ scale, where the mean is 100 and the standard deviation is 15.
Is a Raw Score the Same as a Percent Correct?
No — and this is the single most common raw-score mistake. Percent correct and percentile are two different things, and a raw score is neither of them until you do the conversion. A student who answers 42 out of 50 questions correctly has 84% correct. That is a fact about the test paper, not about the group. The 84th percentile is a fact about the group: it means the student beat 84% of the people who took the test. The two numbers happen to look similar here (84 and 84), but they measure different things — and on a hard test, 84% correct might be the 99th percentile, while on an easy test it might be the 40th.
Here is the trap, worked: two students both score 42 out of 50 (84% correct). One took a hard test where the class average was 30; the other took an easy test where the average was 45. The first student’s 42 is far above the group; the second’s is below it. Same raw score, same percent correct, completely different percentiles. Percent correct tells you how much of the paper you got right. Percentile tells you how you did compared with everyone else. Never read one as the other.
If you want the percentile, convert the raw score to a z-score first (see the z-score guide), then look up the percentile — the test score percentile calculator does both steps. The SAT percentiles guide shows the same distinction on a real admissions test.
What Is the Difference Between a Raw Score and a Scaled Score?
A scaled score is a raw score that has been rescaled onto a fixed, familiar range so that scores from different versions of a test can be compared. The raw score is the starting point; the scaled score is the finished, reportable number. The SAT is the classic example: your raw score (the number of questions you answered correctly) is converted to a scaled score between 200 and 800. Two students who sat different SAT sittings can compare their 200–800 scores directly, even though the papers were different — something their raw scores would never allow.
Between the raw score and the scaled score sits a whole ladder of conversions, and each rung has a job:
Raw score → Z-score → T-score → Stanine → Scaled score
A z-score centres the raw score on the group (mean 0, SD 1). A T-score stretches it onto a friendlier scale (mean 50, SD 10), so nobody has to read negative numbers. A stanine compresses it into nine bands (1–9, mean 5, SD 2) for quick reporting. And a scaled score — like the SAT’s 200–800 — maps it onto the range the test publisher chose. They are all the same information, expressed in different units.
| Z-score | Raw score (IQ scale) | T-score | Stanine | SAT scaled* |
|---|---|---|---|---|
| −1 | 85 | 40 | 3 | ~400 |
| 0 | 100 | 50 | 5 | ~500 |
| +1 | 115 | 60 | 7 | ~600 |
| +2 | 130 | 70 | 9 | ~700 |
*The T-score and stanine columns are exact conversions (T = 50 + 10z; stanine ≈ 5 + 2z, rounded into bands). The SAT column uses the test’s design scale of mean 500 and standard deviation 100 per section, so treat it as a guide: real SAT distributions drift from the design values. The IQ bell curve calculator shows the same ladder on the IQ scale, and the bell curve generator lets you draw any of these scales.
Converting a Whole Class at Once
Teachers rarely convert one score at a time — they convert a whole class. The formula makes batch conversion easy: because X = Z × SD + Mean is linear, you can convert a set of z-scores in one pass. Take a class test with a mean of 72 and a standard deviation of 6, and convert the z-scores −1, 0, +1 and +2 in a single table:
| Z-score | Calculation | Raw score | Percentile |
|---|---|---|---|
| −1 | −1 × 6 + 72 | 66 | 15.87th |
| 0 | 0 × 6 + 72 | 72 | 50th |
| +1 | 1 × 6 + 72 | 78 | 84.13th |
| +2 | 2 × 6 + 72 | 84 | 97.72nd |
One table, four conversions, no repeated arithmetic. The same trick works on the IQ scale (mean 100, SD 15): z = −1, 0, +1 and +2 give raw scores of 85, 100, 115 and 130. If you are converting a list of actual student scores rather than z-scores, convert each raw score to a z-score first — the z-score calculator handles a whole list — then read the percentiles from the empirical rule percentile calculator.
What Raw Score Earns an A?
Grade boundaries are often set as z-scores, not raw scores, because a z-score boundary stays fair when the test changes. Suppose a teacher awards an A to any score at or above z = +1.5. On the class test above (mean 72, SD 6), the A boundary is X = 1.5 × 6 + 72 = 81. A student needs 81 or more for an A — the 93.32nd percentile and above. On the IQ scale the same boundary would be X = 1.5 × 15 + 100 = 122.5. The boundary moves with the test’s mean and spread, which is exactly the point: an A means the same relative performance on any test.
Can a Raw Score Be Negative?
Yes — whenever the scale being measured allows negative values. Temperature is the classic example: −5°C is a perfectly ordinary raw score. Profit and loss work the same way: a business that loses $2,000 has a raw score of −$2,000. Test marks are usually non-negative, but the z-score of a below-average mark is negative — a different number. A z-score of −1 is not a “negative raw score”; it is a raw score one standard deviation below the mean (85 on the IQ scale).
Raw Score vs Z-Score vs T-Score vs Stanine — When to Use Each
Each score has a job. Use the raw score when you need the original measurement. Use the z-score when you need to compare scores across different tests or groups, or to find a percentile. Use the T-score when reporting standardised results to people who should not have to read negative numbers. Use the stanine when a coarse band is enough, such as admissions screening. And use the scaled score (like the SAT’s 200–800) when the test publisher has fixed the reporting scale for you.
| Score | Mean | SD | Range | Use it when… |
|---|---|---|---|---|
| Raw score | varies | varies | varies | you need the original measurement |
| Z-score | 0 | 1 | roughly −3 to +3 | comparing across tests, finding percentiles |
| T-score | 50 | 10 | roughly 20–80 | reporting without negative numbers |
| Stanine | 5 | 2 | 1–9 | a coarse band is enough |
| Scaled (SAT) | 500* | 100* | 200–800 | the publisher fixed the scale |
*SAT design values; real distributions drift. The z-score graph plotter shows where any z-score sits on the curve, and the bell curve generator draws the distribution for any mean and standard deviation.
Raw Scores in Excel
Excel has two functions that cover almost everything in this guide. STANDARDIZE(x, mean, standard_dev) converts a raw score to a z-score: =STANDARDIZE(130,100,15) returns 2. And NORM.DIST(x, mean, standard_dev, TRUE) returns the percentile for a raw score: =NORM.DIST(130,100,15,TRUE) returns 0.9772, the 97.72nd percentile. With the last argument set to FALSE, NORM.DIST returns the height of the curve at x instead — useful for drawing the bell curve, not for percentiles. To go the other way, use NORM.INV(percentile, mean, standard_dev): =NORM.INV(0.9,100,15) returns 119.22, the 90th-percentile raw score on the IQ scale. All three functions are documented on Microsoft Support.
Frequently Asked Questions
What is a raw score in simple terms?
The points you actually earned, before any conversion. If you answered 42 questions correctly out of 50, your raw score is 42. It is the original measurement in the test’s own units, and it only becomes comparable with other tests once it is converted to a z-score or a percentile.
What is the raw score formula?
X = Z × SD + Mean. Multiply the z-score by the standard deviation, then add the mean. The inverse is z = (X − μ) / σ. On the IQ scale (mean 100, SD 15), a z-score of +2 gives X = 2 × 15 + 100 = 130.
How do you find a raw score from a z-score?
Four steps: find the mean, find the standard deviation, take the z-score, then multiply and add (X = Z × SD + Mean). Example: z = +1.5 on the IQ scale gives 122.5. The raw score calculator does the same four steps instantly.
How do you find a raw score from a percentile?
Convert the percentile to a z-score with a z-table (the 90th percentile is z = 1.2816), then use the formula. On the IQ scale the 90th percentile is 119.22 and the 75th is 110.12. The percentile calculator runs the whole chain.
Can a raw score be negative?
Yes, whenever the scale allows negative values — temperature (−5°C) or profit and loss (−$2,000) are ordinary raw scores. Test marks are usually non-negative, but the z-score of a below-average mark is negative; that is a different number.
What raw score is z = 0?
Exactly the mean. A z-score of 0 means the value sits at the centre of the group, the 50th percentile. On the IQ scale that is 100; on a class test with a mean of 72, it is 72.
Does the formula work for non-normal data?
The arithmetic works for any numbers: X = Z × SD + Mean is always valid. But the percentile reading (that z = +2 means the 97.72nd percentile) assumes a normal distribution. On skewed data, use the percentile directly — it is a ranking, not a model.
Raw score vs z-score vs T-score vs stanine — when to use each?
Use the raw score for the original measurement, the z-score to compare across tests or find a percentile, the T-score (mean 50, SD 10) when reporting without negative numbers, and the stanine (1–9) when a coarse band is enough. They are the same information in different units.
Check Tools
Try the numbers from this guide with the site’s free calculators:
Raw Score Calculator
Convert a z-score to a raw score, or a raw score to a z-score and percentile.
Try the Raw Score Calculator →
Z-Score Calculator
Find a z-score, percentile and probability from any raw score.
Empirical Rule Percentile Calculator
Turn any z-score into a percentile, or any percentile into a z-score.
Try the Empirical Rule Percentile Calculator →
Bell Curve Generator
Draw your own bell curve with any mean and standard deviation.
Try the Bell Curve Generator →
Check Articles
Keep reading with these guides from the site:
What Is a Bell Curve?
The normal distribution explained, with the 68-95-99.7 rule and worked examples.
How to Calculate a Z-Score
Turn any value into a z-score with the (x − μ) / σ formula.
Read How to Calculate a Z-Score →
SAT Percentiles Explained
Official College Board tables, the normal model, and what your score means.
Read SAT Percentiles Explained →
What Is a P-Value?
What a p-value really means, and how to read one without fooling yourself.