
A p-value is the probability of getting results at least as extreme as the ones you observed, assuming the null hypothesis is true. If you have ever asked what is a p-value in statistics, the short answer is that it is a measure of surprise: it tells you how unusual your data would look if nothing were really going on. A small p-value means your results would be very unlikely under the null hypothesis, so you have evidence against it. A large p-value means your results are perfectly ordinary under the null hypothesis, so you have little reason to doubt it. In this guide you will learn the p-value definition in plain language, see a coin example and a worked z-score example you can check with our p-value calculator, and learn how to interpret a p-value — and what it can never tell you.
What Is a P-Value in Statistics?
In statistics, a p-value answers one question: if the null hypothesis were true, how likely would I be to see data at least this extreme? The null hypothesis, written H0, is the default claim that there is no effect, no difference, or no change — for example, that a coin is fair, or that a new drug works no better than a placebo. Written as a formula, the p-value definition is:
p = P(data at least this extreme | H0 is true)
The vertical bar means “given that”. So a p-value is a conditional probability: it is computed assuming H0 is true. A p-value is always a number between 0 and 1. The smaller it is, the more surprising your data would be if the null hypothesis were true — and the stronger your evidence against H0. The larger it is, the more ordinary your data look under H0. The standard normal distribution is the reference curve used to turn many test statistics, such as z-scores, into p-values, as you will see in the worked example below. For the formal treatment of hypothesis testing, see the NIST/SEMATECH e-Handbook of Statistical Methods.
What Does P-Value Mean?
Think of a p-value as a surprise meter. A p-value of 0.03 means that if the null hypothesis were true, you would expect results at least this extreme in only 3 out of every 100 repeats of the study. A p-value of 0.40 means the same results would show up 40 times out of 100 — nothing surprising at all. That is the whole p-value meaning in one sentence: a small p-value says “this would be strange if nothing were going on”, and a large p-value says “this is exactly what I would expect if nothing were going on”.
Notice what a p-value does not say. It does not say how likely it is that the null hypothesis is true, and it does not say how big or important an effect is. Those two mistakes are so common that the American Statistical Association issued a formal statement in 2016 warning that p-values are widely misinterpreted.
P-Value Example: The Coin Test
Suppose you flip a coin 10 times and get 9 heads. Is the coin rigged? The null hypothesis is that the coin is fair, so each flip has a 50% chance of heads. The p-value is the probability of getting 9 or more heads in 10 flips with a fair coin. There are 210 = 1,024 possible sequences of 10 flips, and only 11 of them have 9 or 10 heads (10 ways to get exactly 9 heads, plus 1 way to get 10 heads). So the one-tailed p-value is:
p = (10 + 1) / 1,024 = 11 / 1,024 ≈ 0.011
That is about 1.1%. A fair coin gives 9 or more heads in 10 flips about 1 time in 91 — surprising, but not proof that the coin is rigged. If you count extremes in both directions (9 or more heads, or 9 or more tails), the two-tailed p-value is 0.022. At the usual significance level of 0.05, both values are below 0.05, so you would call the result statistically significant — but “significant” here only means “unlikely under the null hypothesis”, not “proven”.
P-Value Example with Z-Score
Most real p-values come from a test statistic, not from counting coin flips. Here is a complete p-value example with z-score, worked step by step. Suppose a test gives a z-score of 2.10 and you want the p-value.
Step 1 — Find the area to the left of z. For z = 2.10, the standard normal table gives Φ(2.10) = 0.9821, which means 98.21% of the area under the curve lies to the left of 2.10. If you are new to tables, see our guide on how to read a z-table; our guide to calculating a z-score shows how to get the z-value in the first place, and a z-score calculator can do the arithmetic for you.
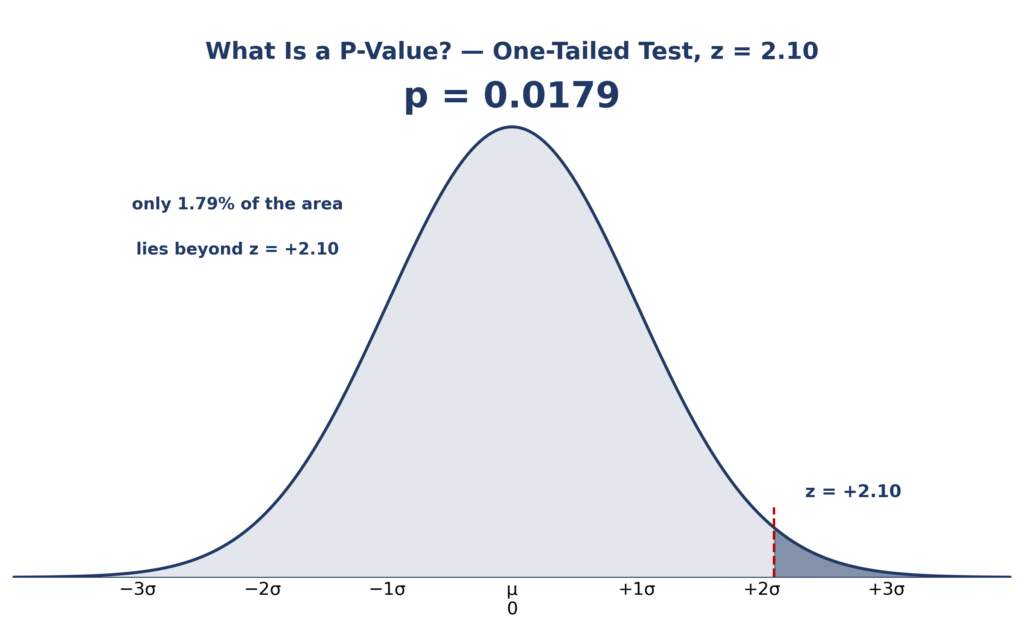
Step 2 — Subtract from 1 for a one-tailed p-value. The right tail beyond z = 2.10 is 1 − 0.9821 = 0.0179. So the one-tailed p-value is 0.0179.
Step 3 — Double it for a two-tailed p-value. The two-tailed p-value is 2 × 0.017864 = 0.0357. You can check both numbers instantly with our P-Value Calculator from Z-Score, or find the same areas with a normal distribution calculator — and the z-score graph plotter will draw the shaded tail for you.
How do you read the result? Both p-values are below 0.05, so the result is statistically significant at α = 0.05. But neither is below 0.01, so it is not significant at α = 0.01. The diagram below shows the same idea: the shaded right tail beyond z = +2.10 is only 1.79% of the total area — that small tail is the one-tailed p-value of 0.0179.
P-Value Example from a Real Study: Commute Times
A classic example from OpenStax Introductory Statistics (via LibreTexts) makes the same idea concrete. Students suspected that the mean commute time was more than 30 minutes, so they tested H0: μ = 30 against Ha: μ > 30. Their sample produced a test statistic of z = 2.40. The one-tailed p-value is the area beyond z = 2.40, which is 1 − Φ(2.40) = 1 − 0.9918 = 0.0082 (the two-tailed p-value would be 0.0164). Because 0.0082 is less than 0.05 — and less than 0.01 too — the result is significant at α = 0.05 and at α = 0.01, and the students rejected the null hypothesis: the evidence supports a mean commute longer than 30 minutes. You will need the sample mean and spread before you can compute a z-score like this — our standard deviation calculator can help with the spread.
LibreTexts adds an important warning that many textbooks skip: statistical significance is not the same as practical significance. A mean commute of 31 minutes instead of 30 might be statistically significant with a large sample, yet make no real difference to anyone’s day. Always ask how big the effect is, not only whether the p-value is small.
How to Interpret P-Value
Use this p-value interpretation scale as a rough guide. It describes the strength of the evidence against the null hypothesis — it is not a set of hard rules, and it never turns a p-value into proof.
| P-value | Evidence against H0 | What it means |
|---|---|---|
| p < 0.001 | Very strong | Results this extreme would be almost impossible if H0 were true. |
| p < 0.01 | Strong | Strong evidence against H0. |
| p < 0.05 | Moderate | Significant at α = 0.05; evidence against H0. |
| p < 0.10 | Weak | Only weak evidence against H0. |
| p ≥ 0.10 | Little or none | The data are compatible with H0. |
To interpret any p-value, follow these four steps:
- State the null hypothesis (H0) and the significance level (α), usually 0.05, before you look at the data.
- Calculate the p-value from your test statistic — for example, from a z-score.
- Compare the p-value with α: if p ≤ α, reject H0; if p > α, do not reject H0.
- Report the exact p-value together with the effect size and a confidence interval.
Two cautions. First, “do not reject H0” is not the same as “H0 is true” — a large p-value can simply mean your sample was too small to detect the effect. Second, a p-value of 0.049 and a p-value of 0.051 are almost identical evidence, even though one side of the 0.05 line is called “significant” and the other is not. Treat the line as a convention, not a cliff.
There is no universal “good” p-value. The usual bar is p < 0.05, which means the result is significant at the 5% level. In stricter fields, such as medicine, researchers often want p < 0.01 or even p < 0.001 before they trust a result. A good p-value is simply one below the significance level you chose before collecting data — and a p-value just above that line is not a failure, it is just weaker evidence. What makes a p-value convincing is not only its size, but a clear hypothesis, a sensible sample size, and an effect that is large enough to matter.
P-Value vs Alpha (Significance Level)
The p-value and the significance level, alpha (α), are often confused, but they play opposite roles. Alpha is a threshold you choose before the test — usually 0.05 — and it is the probability of rejecting a true null hypothesis that you are willing to accept. The p-value is a number computed from your data after the test. The decision rule is simple:
| Alpha (α) | P-value (p) | |
|---|---|---|
| Chosen | Before the test | Computed from the data after the test |
| Meaning | The false-positive risk you accept (usually 0.05) | How surprising the data are if H0 is true |
| Decision | The threshold | Compare with α: p ≤ α → reject H0; p > α → do not reject H0 |
Choosing α after seeing the p-value defeats the purpose of the test. Pick α in advance, run the test once, and let the comparison decide.
One-Tailed vs Two-Tailed P-Value
A one-tailed test looks for an effect in one direction only (“greater than” or “less than”), so its p-value is the area in a single tail. A two-tailed test looks for an effect in either direction (“different from”), so its p-value is the area in both tails — for a symmetric distribution such as the normal curve, exactly double the one-tailed value. The coin example shows the difference: 9 heads in 10 flips gives a one-tailed p-value of 0.011 (only “too many heads”) and a two-tailed p-value of 0.022 (9 or more heads, or 9 or more tails). Decide which test you are running before you see the data — switching to a one-tailed test after seeing the result is a form of p-hacking.
| One-tailed | Two-tailed | |
|---|---|---|
| Tests | An effect in one direction (“greater than” or “less than”) | An effect in either direction (“different from”) |
| P-value | Area in one tail | Area in both tails (double, for a symmetric curve) |
| Example (z = 2.10) | p = 0.0179 | p = 0.0357 |
| Example (coin, 9 heads in 10) | p = 0.011 | p = 0.022 |
What a P-Value Is — and Is Not
| A p-value IS | A p-value IS NOT |
|---|---|
| The probability of data at least this extreme if H0 is true | The probability that H0 is true |
| A measure of how surprising the data are under H0 | The probability that the result is due to chance alone |
| A tool for deciding whether to reject H0 at a chosen α | The size or importance of the effect |
| Always between 0 and 1 | Proof that an effect is real — or that it is not |
P-Value Misconceptions
Four mistakes account for most misread p-values. Myth 1: “p = 0.03 means there is a 3% chance the null hypothesis is true.” Wrong — the p-value assumes H0 is true and says nothing about the probability of H0 itself. Myth 2: “p = 0.08 proves there is no effect.” Wrong — it only means the data do not provide enough evidence to reject H0; the effect may be real but too small for the sample to detect. Myth 3: “A smaller p-value means a bigger effect.” Wrong — a tiny effect can have a tiny p-value if the sample is huge (see effect size below). Myth 4: “p = 0.04 means the result is 96% likely to replicate.” Wrong — a p-value says nothing about replication; replication depends on power, sample size and honest methods.
P-Value and Effect Size
A p-value says whether there is an effect, not how big it is. With a huge sample, even a trivial difference — a fraction of a point — can be “statistically significant”. With a tiny sample, a large and important difference can be “non-significant”. That is why a p-value should never stand alone: always report the effect size (how large the difference is) and a confidence interval (the range of values consistent with the data) alongside it. A p-value tells you whether to take a result seriously; the effect size tells you whether it matters.
P-Hacking: How P-Values Get Misused
P-hacking is running many tests — or tweaking the analysis — until one of them turns out significant. The problem is simple arithmetic: at α = 0.05, each test on pure noise has a 5% chance of a false “significant” result, so 20 such tests give about 1 false positive on average (20 × 0.05 = 1). Run 100 tests and you can expect about 5 false positives, even when nothing is real. The fixes are to preregister your hypothesis and analysis plan before collecting data, to correct for multiple comparisons (the Bonferroni correction divides α by the number of tests), and to report all the tests you ran — not only the ones that “worked”.
How to Report a P-Value (APA Style)
APA style asks for the exact p-value whenever possible: write p = .036, not “p < .05”. For very small values, write p < .001 — never write p = .000, because a p-value is never exactly zero. Report the test statistic and degrees of freedom with it, for example t(48) = 2.15, p = .036, and add the effect size so readers can judge whether the result matters.
A p-value of 0.05 means that if the null hypothesis were true, results at least this extreme would occur 5 times in every 100 repeats of the study. It sits exactly on the usual cutoff: p ≤ 0.05 is called “significant”, so p = 0.05 is significant by that rule — but only just. Because 0.05 is a convention inherited from R. A. Fisher in the 1920s, not a law of nature, a p-value of 0.049 and one of 0.051 carry almost the same evidence. Report the exact value and let readers judge.
Can a P-Value Be 0 or 1?
A p-value always lies between 0 and 1, so it can never be greater than 1 or less than 0. It can be extremely close to 0 — for a very large z-score, the tail area is microscopic — but in practice you report it as p < .001 rather than writing 0. A p-value of exactly 1 means your data match the null hypothesis perfectly (the observed result equals the expected result), which is rare with real data. If software prints a p-value of 0.000, it means the value was rounded, not that it is truly zero.
Frequently Asked Questions
What is a p-value in simple terms?
A p-value is the probability of seeing results at least as extreme as yours if the null hypothesis — the idea that nothing is going on — were true. A small p-value (usually below 0.05) means your results would be surprising under the null hypothesis, so you have evidence against it.
What does p-value mean in statistics?
In statistics, a p-value measures how compatible your data are with the null hypothesis. It is the probability of the observed data (or more extreme data) given that H0 is true. It is not the probability that H0 is true, and it is not the size of the effect.
How do you interpret a p-value?
Compare it with your significance level α (usually 0.05): if p ≤ α, reject the null hypothesis; if p > α, do not reject it. Smaller p-values are stronger evidence against H0: below 0.001 is very strong, below 0.01 is strong, below 0.05 is moderate, and above 0.10 is little or no evidence.
What is a good p-value?
There is no single “good” p-value. The usual standard is p < 0.05, and stricter fields may require p < 0.01 or p < 0.001. A good p-value is one below the significance level you chose before collecting data, backed by a meaningful effect size.
What is the difference between a p-value and alpha?
Alpha (α) is the significance threshold you choose before the test (usually 0.05) — the risk of a false positive you are willing to accept. The p-value is computed from your data after the test. If p ≤ α, you reject the null hypothesis; if p > α, you do not.
What is the difference between a one-tailed and a two-tailed p-value?
A one-tailed p-value counts the area in one tail of the distribution and tests for an effect in a single direction. A two-tailed p-value counts both tails and tests for an effect in either direction; for a symmetric distribution it is double the one-tailed value (for example, 0.0357 vs 0.0179 for z = 2.10).
Can a p-value be greater than 1?
No. A p-value is a probability, so it always lies between 0 and 1. A value printed as 0.000 is a rounded value — report it as p < .001.
What does a p-value of 0.05 mean?
It means results at least this extreme would occur 5% of the time if the null hypothesis were true. It is exactly on the usual significance cutoff, so it counts as significant at α = 0.05 — but the evidence it carries is almost the same as p = 0.051, which does not.
Check Tools
P-Value Calculator from Z-Score
Turn any z-score into a one-tailed or two-tailed p-value in one click.
ToolsTry Calculator →● LiveZ-Score Calculator
Convert any value to a z-score, or turn a z-score back into a raw value.
ToolsTry Calculator →● LiveNormal Distribution Calculator
Find probabilities, percentiles and areas under the normal curve.
ToolsTry Calculator →● LiveZ-Score Graph Plotter
See your z-score plotted on a bell curve with the tail area shaded.
ToolsTry Calculator →● LiveStandard Deviation Calculator
Calculate the mean, variance, population standard deviation (σ) and sample standard deviation (s) for any data set.
ToolsTry Calculator →● LiveExplore All Statistical Tools
Browse the complete collection of free statistical tools and calculators on one page.
ToolsTry Calculator →Check Articles
How to Calculate a Z-Score
Learning how to calculate a z score is the key to reading any normal distribution.
ArticleRead Article →● LiveHow to Read a Z-Table
Learning how to read a z table is one of the fastest skills in statistics: once you can read one row and one column, you can turn any z-score into a probability in seconds.
ArticleRead Article →● LiveStandard Normal Distribution
The standard normal distribution is the one normal distribution every other normal distribution can be turned into.
ArticleRead Article →● LiveNormal Distribution Examples
These normal distribution examples show how the bell curve works in real life — with a mean, a standard deviation, and an exact probability for every case.
ArticleRead Article →● LiveWhat Is Margin of Error
It is the ± number printed after a survey result — the radius of the confidence interval around that result.
ArticleRead Article →● LiveMargin of Error vs Confidence Interval
The margin of error vs confidence interval question comes down to this: the margin of error is the ± number, and the confidence interval is the range that number creates.
ArticleRead Article →