
What is margin of error? It is the ± number printed after a survey result — the radius of the confidence interval around that result. When a poll says "52% support the proposal, with a margin of error of ±3.1% at 95% confidence," it means the true level of support in the whole population is probably somewhere between 48.9% and 55.1%. The margin of error is not a mistake in the survey. It is a measurement of how precisely the sample pins down the population value. This guide gives you the plain margin of error definition, the margin of error formula for proportions and for means, two worked examples, and the rules for choosing a sample size — and you can check any number with our Margin of Error Calculator.
A sample of 1,000 people is not the whole population, so its result wobbles a little from the truth. The margin of error puts a number on that wobble. It depends on three things only: how big the sample is, how spread out the answers are, and how confident you want to be. Change any one of them and the margin of error changes — and, as the sections below show, the direction of each change is not always the one people expect.
In statistics, the margin of error definition is simple: it is the largest amount, in either direction, by which a sample estimate is expected to differ from the true population value, at a stated confidence level. It is half the width of the confidence interval. If the estimate is 52% and the margin of error is ±3.1%, the confidence interval runs from 52% − 3.1% = 48.9% to 52% + 3.1% = 55.1%.
Read "52% ± 3.1% at 95% confidence" like this: if the same survey were repeated many times, about 95 out of 100 of the intervals built this way would contain the true population value. It does not mean there is a 95% chance that this particular interval contains the truth, and it does not mean 95% of respondents answered a certain way. The 95% describes the method, not this one result.
Three facts keep the idea straight. First, the margin of error measures sampling error only — the error from asking some people instead of everyone. It says nothing about biased questions, a bad sample, or people who refuse to answer. Second, it shrinks as the sample grows, but slowly: you must quadruple the sample to halve it. Third, it is always reported with a confidence level. A margin of error without one is meaningless, because the same data give a bigger margin at 99% confidence than at 90%.
Margin of Error Formula
There are two margin of error formulas — one for a proportion (a percentage) and one for a mean (an average). Both have the same shape: a critical value times a standard error.
For a proportion: MoE = z* × √(p(1 − p) / n), where p is the sample proportion, n is the sample size, and z* is the critical value for your confidence level.
For a mean: MoE = z* × (σ / √n), where σ is the population standard deviation and n is the sample size. If σ is unknown and the sample is small, replace z* with t* and σ with the sample standard deviation s (see the z-vs-t section below).
The critical values worth memorising are: 90% confidence → z* = 1.645; 95% confidence → z* = 1.96; 99% confidence → z* = 2.58. These come from the standard normal distribution — the same distribution our z-score calculator works with — and 1.96 is the value used in almost every poll you will ever read. The definitions behind these formulas are set out in the NIST/SEMATECH e-Handbook of Statistical Methods.
Both formulas say the same thing in different clothes: the margin of error is the standard error (how much the estimate wobbles from sample to sample) stretched by the critical value (how sure you want to be). A bigger sample shrinks the standard error; a higher confidence level stretches the critical value.
Margin of Error Formula with Example
Example — a proportion. A survey of n = 1,000 voters finds that 52% support a proposal. What is the margin of error at 95% confidence?
Step 1 — Find the standard error. SE = √(p(1 − p) / n) = √(0.52 × 0.48 / 1,000) = √(0.2496 / 1,000) = √0.0002496 = 0.0158.
Step 2 — Multiply by the critical value. At 95% confidence, z* = 1.96, so MoE = 1.96 × 0.0158 = 0.0310 = ±3.1%.
Step 3 — Build the confidence interval. 52% − 3.1% = 48.9% and 52% + 3.1% = 55.1%. The result is reported as "52% ± 3.1%," with a 95% confidence interval of 48.9% to 55.1%.
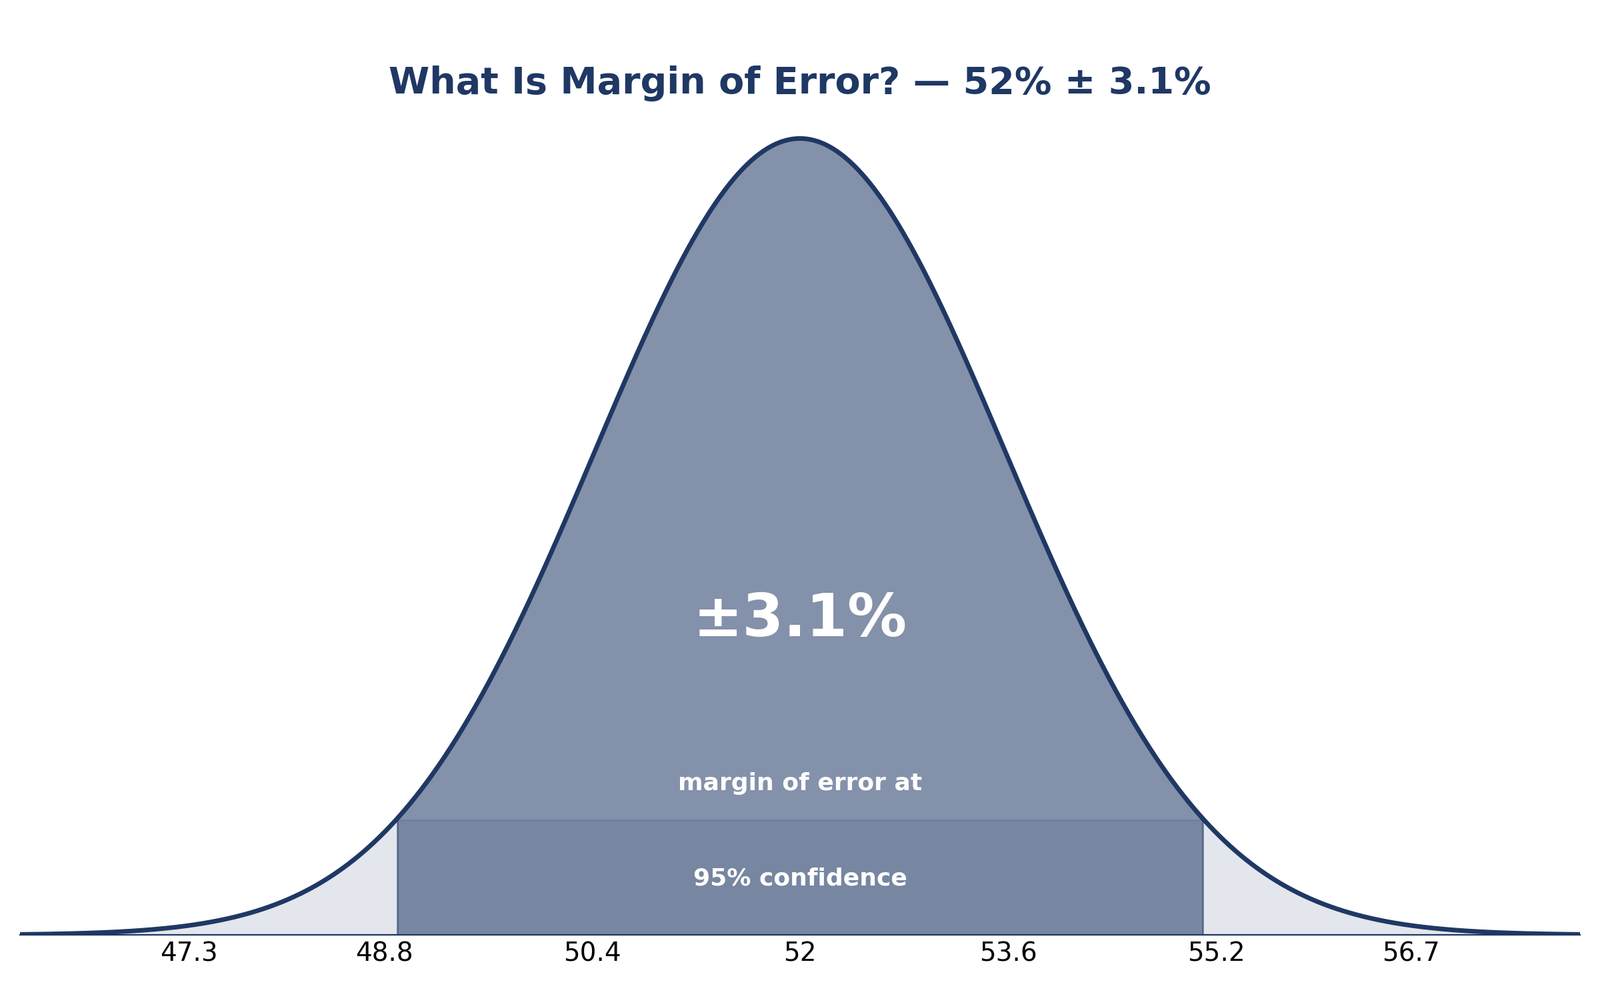
Notice what the numbers mean in practice: because the interval 48.9%–55.1% straddles 50%, this poll cannot say whether a majority supports the proposal. A result of 52% with a ±3.1% margin of error is a statistical dead heat, and any headline claiming a lead would be wrong.
Margin of Error for a Mean
Example — a mean. A sample of n = 100 test scores has a mean of 100 and a population standard deviation of σ = 15. What is the margin of error at 95% confidence?
Step 1 — Find the standard error. SE = σ / √n = 15 / √100 = 15 / 10 = 1.50.
Step 2 — Multiply by the critical value. MoE = 1.96 × 1.50 = 2.94.
Step 3 — Build the confidence interval. 100 − 2.94 = 97.06 and 100 + 2.94 = 102.94. The mean is reported as 100 ± 2.94, with a 95% confidence interval of 97.06 to 102.94.
The same three steps work for any mean — a mean height, a mean income, a mean reaction time — provided the sample is large enough for the normal approximation (usually n ≥ 30) or the data are roughly normal. You can check the arithmetic with our confidence interval from mean and standard deviation calculator. If you need σ itself, start with our standard deviation calculator and our guide to calculating standard deviation. When σ is not known and the sample is small, the t-distribution takes over, which is the next section's subject.
How to Calculate Margin of Error
Every margin of error calculation follows the same four steps, whichever formula you use:
- Pick the confidence level and its critical value. 90% → z* = 1.645, 95% → z* = 1.96, 99% → z* = 2.58. For a small sample with an unknown σ, use t* instead.
- Find the standard error. For a proportion: SE = √(p(1 − p) / n). For a mean: SE = σ / √n.
- Multiply. MoE = critical value × standard error.
- Build the interval. Estimate − MoE to estimate + MoE, and report the result as "estimate ± MoE at your confidence level."
Worked in full above, these steps give 52% ± 3.1% for the proportion example and 100 ± 2.94 for the mean example. If you only need the answer, our free calculator runs the same steps — but knowing the steps tells you why the answer changes when the sample size or the confidence level changes.
Z or T? Choosing the Right Critical Value
Use z* when the population standard deviation σ is known, or when the sample is large (n ≥ 30), so the sample standard deviation is a good stand-in for σ. Use t* when σ is unknown and the sample is small, with degrees of freedom df = n − 1.
| Situation | Use | Critical value at 95% |
|---|---|---|
| σ known (any n) | z* | 1.96 |
| σ unknown, n ≥ 30 | z* | 1.96 |
| σ unknown, n < 30 | t* (df = n − 1) | Depends on n |
For example, with n = 25 and σ unknown, df = 24 and t* = 2.064 at 95% confidence — larger than 1.96, because a small sample carries more uncertainty. As n grows, t* slides down towards 1.96, and by n = 100 the difference is negligible. The z* values themselves come from the standard normal distribution; our guide to calculating a z-score explains that side of the picture, and the difference between a known and an estimated σ is the same one behind population vs sample standard deviation.
Yes — higher confidence makes the margin of error bigger, never smaller. At 90% confidence z* = 1.645, at 95% z* = 1.96, and at 99% z* = 2.58. Because the margin of error is z* times the standard error, raising the confidence level stretches the interval. For the same survey of 1,000 voters at 52%, the margin of error is ±2.6% at 90% confidence, ±3.1% at 95%, and ±4.1% at 99% (1.645 × 0.0158 = 0.0260; 2.58 × 0.0158 = 0.0408).
This is a common misconception, and it appears in print: at least one popular online guide claims that raising the confidence level from 90% to 95% reduces the margin of error. That is backwards. A higher confidence level means you want to be surer of catching the true value, so you must cast a wider net — a wider interval, a larger margin of error. There is no free lunch: you pay for extra confidence with extra width, and you pay for a narrower interval with a bigger sample.
| Confidence level | z* | MoE for the 52% poll (n = 1,000) |
|---|---|---|
| 90% | 1.645 | ±2.6% |
| 95% | 1.96 | ±3.1% |
| 99% | 2.58 | ±4.1% |
The 1/√n Scaling Law
The margin of error shrinks with the square root of the sample size, not with the sample size itself. Because the standard error divides by √n, quadrupling the sample halves the margin of error — and doubling the sample only cuts it by about 29% (1 − 1/√2 ≈ 0.29).
| Sample size (n) | MoE at 95% (p = 0.5) |
|---|---|
| 100 | ±9.8% |
| 400 | ±4.9% |
| 1,600 | ±2.45% |
| 10,000 | ±0.98% |
This is why going from 100 to 400 respondents is a huge improvement (9.8% to 4.9%), while going from 1,600 to 10,000 buys only about 1.5 percentage points. Past about 1,000 respondents, each extra respondent buys less and less precision, and that is why most professional polls stop near 1,000–1,500: the next 1,000 interviews would cost as much as the first 1,000 and shave less than a point off the margin of error.
Margin of Error Sample Size
To choose a sample size before you survey, rearrange the proportion formula: n = (z*² × p(1 − p)) / E², where E is the margin of error you will accept, written as a decimal.
For a ±3% margin of error at 95% confidence (using p = 0.5, the cautious choice that gives the largest sample): n = (1.96² × 0.25) / 0.03² = 0.9604 / 0.0009 = 1,067.1, so you need 1,068 respondents.
For a ±5% margin of error at 95% confidence: n = 0.9604 / 0.05² = 0.9604 / 0.0025 = 384.16, so about 384 respondents.
Why p = 0.5? Because p(1 − p) is largest at p = 0.5, so planning with p = 0.5 guarantees your margin of error even if the true proportion turns out to be anything else. If you already know the proportion is near 0.1 or 0.9, you can plan with that value and need fewer people — but never plan with a p you merely hope for. Run the numbers first with our margin of error calculator before you pay for interviews.
There is no single "good" number — it depends on what the result is for — but these bands are the standard yardstick:
| Margin of error | Rating | Typical use |
|---|---|---|
| ±1–3% | Excellent | Large national surveys and election polls |
| ±3–5% | Good | Standard polls and market research |
| ±5–10% | Acceptable | Small studies and internal surveys |
| More than ±10% | Weak | Use with caution — the interval is wider than most effects you want to detect |
A ±3% poll can tell candidates apart when they are 8 points apart; it cannot when they are 2 points apart. And a ±12% study of 60 people can still be useful if the effect you are looking for is 30 points wide. Judge the margin of error against the size of the difference that matters, not against an abstract standard.
Margin of Error vs Confidence Interval
The margin of error and the confidence interval are two views of the same calculation. The margin of error is the ± number (3.1%); the confidence interval is the range it creates (48.9% to 55.1%). The margin of error is the radius; the confidence interval is the whole span. The interval is always estimate ± margin of error, so if you have one, you have the other.
Report the margin of error when you want a single number for precision ("±3.1%"), and the confidence interval when you want the reader to see the plausible range ("48.9% to 55.1%"). Our empirical rule vs confidence interval guide explains where intervals come from, and the empirical rule confidence interval calculator builds one from a mean and standard deviation.
Margin of Error vs Standard Error
The standard error is the raw wobble of the estimate from sample to sample (0.0158 in the 52% poll); the margin of error is that wobble stretched by the critical value (1.96 × 0.0158 = 0.0310). The standard error depends only on the data; the margin of error also depends on the confidence level you choose. Two polls with the same standard error have different margins of error if one reports 90% confidence and the other 99%.
In short: standard error is how noisy the estimate is; margin of error is how wide an interval you need to be that confident. Keep the two apart and the formulas stop looking like alphabet soup.
Common Mistakes to Avoid
- Reading "52% ± 3.1%" as "52% of people, give or take 3.1% of people." The ± is about the estimate, not about individual respondents.
- Thinking a higher confidence level shrinks the margin of error. It grows it: 90% → ±2.6%, 95% → ±3.1%, 99% → ±4.1% for the same poll.
- Comparing two polls by their point estimates alone. If their intervals overlap, the difference may be noise — always compare intervals, not single numbers.
- Using the z-value for a small sample with an unknown σ. Below n = 30, use t* with df = n − 1, or the interval will be too narrow.
- Quoting a margin of error without its confidence level. "±3%" means nothing until you know whether it is 90%, 95% or 99%.
- Forgetting that the margin of error covers sampling error only. A biased sample with a ±2% margin of error is precisely wrong.
Frequently Asked Questions
What is margin of error in statistics?
The margin of error is the ± number after a survey result. It is half the width of the confidence interval: for a result of 52% with a margin of error of ±3.1% at 95% confidence, the true population value is plausibly between 48.9% and 55.1%.
How do you calculate margin of error?
Multiply a critical value by the standard error. For a proportion, MoE = z* × √(p(1 − p) / n); for a mean, MoE = z* × (σ / √n). At 95% confidence z* = 1.96. Then add and subtract the result from the estimate to get the confidence interval.
What is a good margin of error?
±1–3% is excellent, ±3–5% is good and is the standard for most polls, ±5–10% is acceptable for small studies, and more than ±10% is weak. Judge it against the size of the difference you need to detect.
Does higher confidence increase margin of error?
Yes. Raising the confidence level raises the critical value — 1.645 at 90%, 1.96 at 95%, 2.58 at 99% — so the margin of error grows. For the 52% poll of 1,000 voters it is ±2.6% at 90% confidence, ±3.1% at 95% and ±4.1% at 99%.
What is the difference between margin of error and confidence interval?
The margin of error is the ± number (3.1%); the confidence interval is the range it makes (48.9% to 55.1%). The margin of error is the radius of the interval; the interval is the estimate plus and minus the margin of error.
What is the difference between margin of error and standard error?
The standard error measures how much the estimate wobbles from sample to sample; the margin of error is the standard error multiplied by the critical value for your confidence level. The standard error depends only on the data, while the margin of error also depends on the confidence level.
How many people do I need for a margin of error of ±5%?
At 95% confidence, about 384 respondents (using p = 0.5). For ±3% you need 1,068. The formula is n = (z*² × p(1 − p)) / E².
When do I use z and when do I use t?
Use z* when σ is known or the sample is large (n ≥ 30). Use t* when σ is unknown and the sample is small, with df = n − 1. For n = 25 at 95% confidence, t* = 2.064.
Check Tools
Margin of Error Calculator
Find the margin of error and the confidence interval for a survey result or a mean.
ToolsTry Calculator →● LiveEmpirical Rule Confidence Interval Calculator
Build a confidence interval from a mean and standard deviation with the empirical rule.
ToolsTry Calculator →● LiveConfidence Interval from Mean and Standard Deviation Calculator
Find a confidence interval for a mean, with z or t, from a mean and standard deviation.
ToolsTry Calculator →● LiveZ-Score Calculator
Convert any value to a z-score, or turn a z-score back into a raw value.
ToolsTry Calculator →● LiveStandard Deviation Calculator
Calculate the mean, variance, population standard deviation (σ) and sample standard deviation (s) for any data set.
ToolsTry Calculator →● LiveExplore All Statistical Tools
Browse the complete collection of free statistical tools and calculators on one page.
ToolsTry Calculator →Check Articles
How to Calculate Standard Deviation
How to calculate standard deviation: find the mean, subtract the mean from each value and square each result, add the squared deviations, then divide by N for a population (or by n − 1 for a sample) and take the square root.
ArticleRead Article →● LivePopulation vs Sample Standard Deviation
Population vs sample standard deviation is the difference between describing a whole group and describing just part of it.
ArticleRead Article →● LiveHow to Calculate a Z-Score
Learning how to calculate a z score is the key to reading any normal distribution.
ArticleRead Article →● LiveWhat is the Empirical Rule?
It is the statistical rule, also called the 68-95-99.7 rule, that in a normal distribution 68.27% of values lie within one standard deviation of the mean, 95.45% within two standard deviations and 99.73% within three.
ArticleRead Article →● LiveNormal Distribution and the Empirical Rule: Complete Guide
The normal distribution and empirical rule describe one pattern: 68.27% of the data falls within one standard deviation of the mean, 95.45% within two and 99.73% within three.
ArticleRead Article →● LiveEmpirical Rule vs. Confidence Intervals: What’s the Difference?
The empirical rule describes data: in a normal population, 68.27% of values fall within ±1σ, 95.45% within ±2σ and 99.73% within ±3σ of the mean.
ArticleRead Article →