
What is the difference between margin of error and confidence interval? The margin of error vs confidence interval question comes down to this: the margin of error is the ± number, and the confidence interval is the range that number creates. If a poll reports 52% ± 3.1%, the margin of error is 3.1 percentage points and the confidence interval is 48.9% to 55.1%. One is the radius; the other is the whole span. This guide works in both directions — from a margin of error to an interval and back — with two worked examples, the 1/√n rule, and the misconceptions that catch even careful readers. You can check any number here with our Margin of Error Calculator.
Both numbers describe the same uncertainty, so confusing them is easy — and the confusion has consequences. Read "52% ± 3.1%" as a clear lead and you will call an election wrong; read two overlapping intervals as "no difference" and you will miss a real gap. The sections below keep the two ideas apart and show the arithmetic in full.
Margin of Error vs Confidence Interval: The Difference
Short answer: the margin of error is half the width of the confidence interval. The confidence interval is the range of plausible values for the population value; the margin of error is the distance from the estimate to either end of that range. If the estimate is 52% and the margin of error is ±3.1%, the interval is 52% − 3.1% = 48.9% to 52% + 3.1% = 55.1%, and its width, 6.2 percentage points, is exactly twice the margin of error.
| Margin of error | Confidence interval | |
|---|---|---|
| What it is | The ± number: the radius around the estimate | The range: estimate ± margin of error |
| What it reports | How far the estimate might be off | The plausible values for the true value |
| Example — 52% poll | ±3.1 percentage points | 48.9% to 55.1% |
| Example — mean of 100 | ±2.94 | 97.06 to 102.94 |
| Width | One number | Always twice the margin of error |
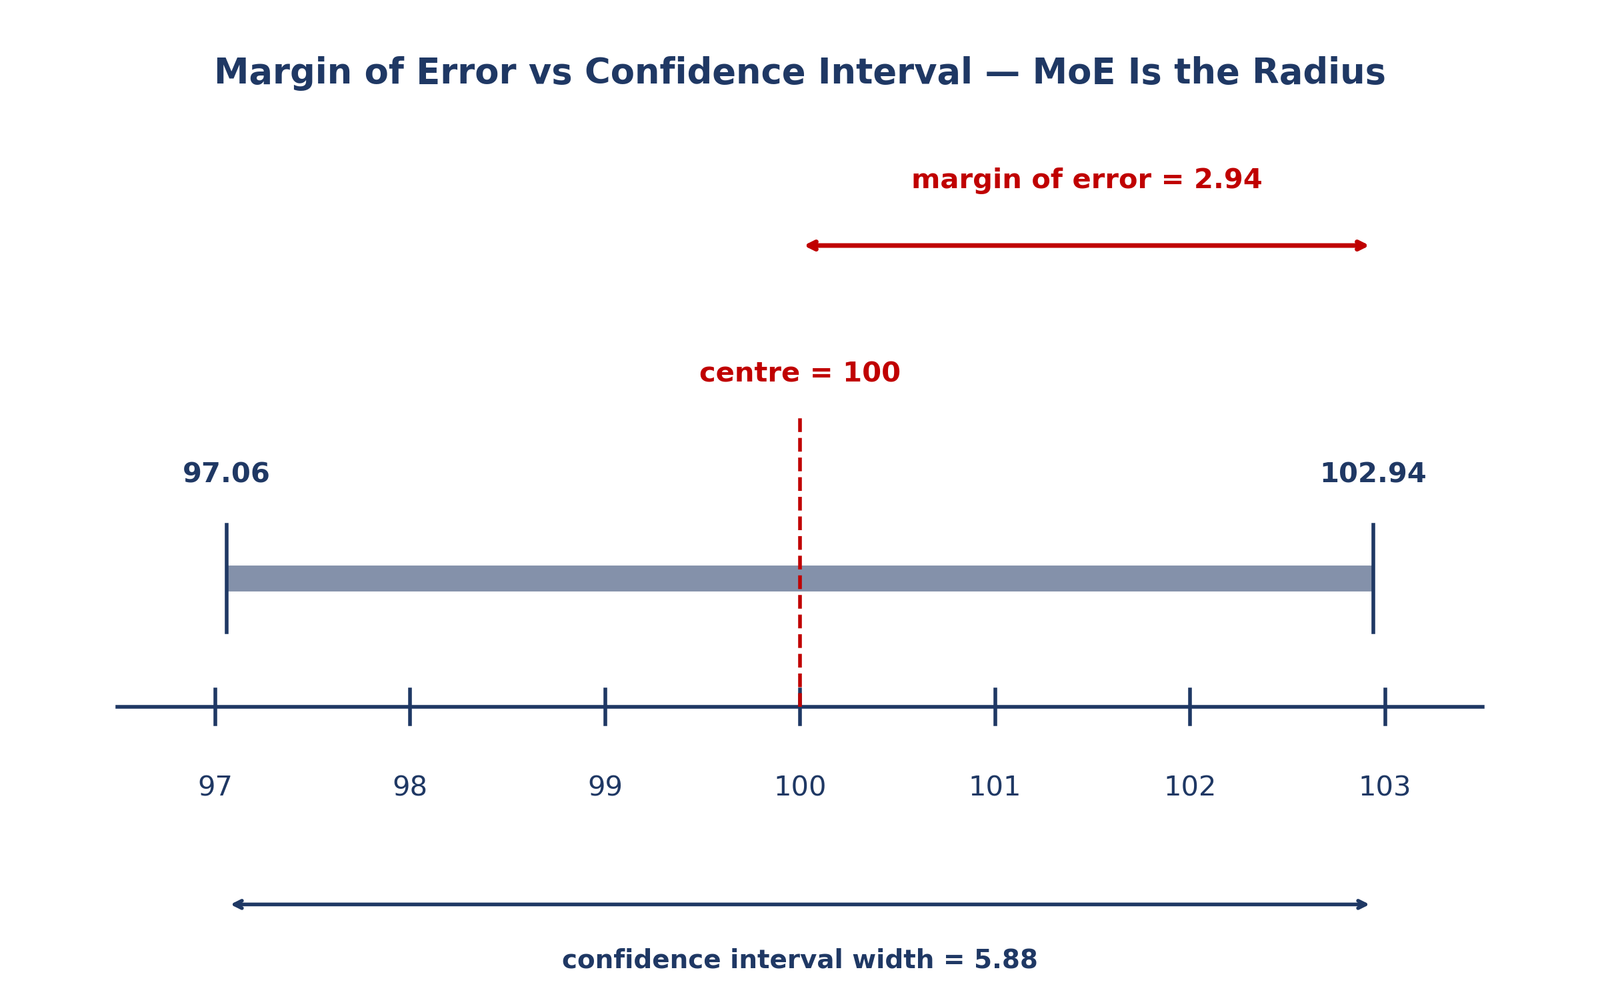
Think of a dartboard: the estimate is the bullseye, the margin of error is the radius of the ring around it, and the confidence interval is the whole ring. A bigger sample shrinks the ring; a higher confidence level widens it. The diagram shows the mean example from this guide: the interval 97.06 to 102.94 as a bar, the centre at 100, and the margin of error, 2.94, as the radius.
What Is a Margin of Error?
The margin of error definition is simple: it is the largest amount, in either direction, by which a sample estimate is expected to differ from the true population value at a stated confidence level. It is always a ± number, always tied to a confidence level, and it measures sampling error only — the error from asking some people instead of everyone. It says nothing about biased questions, a bad sample, or people who refuse to answer. Our guide to what a margin of error is covers the idea in full.
The margin of error formula has the same shape for proportions and for means: a critical value times a standard error. For a proportion: MoE = z* × √(p(1 − p) / n). For a mean: MoE = z* × (σ / √n). The critical values worth memorising are 90% → z* = 1.645, 95% → z* = 1.96, and 99% → z* = 2.58. They come from the standard normal distribution — the same distribution our z-score calculator works with — and the definitions behind them are set out in the NIST/SEMATECH e-Handbook of Statistical Methods.
The confidence interval definition is the mirror image: a range of values, built from the sample, that is likely to contain the true population value. It is the estimate plus and minus the margin of error, so a confidence interval is always reported as two numbers — a lower bound and an upper bound — plus the confidence level. A 95% confidence interval of 48.9% to 55.1% says the true level of support is plausibly anywhere in that range.
The confidence interval formula is CI = estimate ± MoE, which expands to CI = estimate ± z* × SE. For a mean with a known σ: CI = sample mean ± z* × (σ / √n). For a proportion: CI = sample proportion ± z* × √(p(1 − p) / n). If you want the arithmetic done for you, the empirical rule confidence interval calculator builds an interval from a mean and standard deviation, and the confidence interval from mean and standard deviation calculator handles the z and t cases.
Yes — the margin of error is half the confidence interval's width. That is the whole relationship in one line: MoE = (upper bound − lower bound) / 2, and CI width = 2 × MoE. For the mean example, the interval 97.06 to 102.94 is 5.88 wide, and half of 5.88 is 2.94 — exactly the margin of error. For the poll, the interval 48.9% to 55.1% is 6.2 percentage points wide, and half of 6.2 is 3.1 — exactly the margin of error.
The one thing to watch: "half the confidence interval" means half its width, not half its value. The interval 97.06 to 102.94 is not "half of 102.94"; it is a span of 5.88, and the margin of error is half of that span. Keep "width" in the sentence and the idea never goes wrong.
How to Find a Confidence Interval from the Margin of Error
Going from a margin of error to a confidence interval takes three steps, and going back takes one division. The steps below are the same ones the worked examples use.
- Start with the sample estimate. That is the number the margin of error is attached to — 52% in the poll, 100 in the test-score example.
- Subtract the margin of error to get the lower bound. 52% − 3.1% = 48.9%; 100 − 2.94 = 97.06.
- Add the margin of error to get the upper bound. 52% + 3.1% = 55.1%; 100 + 2.94 = 102.94. The interval is lower bound to upper bound: 48.9% to 55.1%, or 97.06 to 102.94.
To find the margin of error from a confidence interval, reverse it: MoE = (upper bound − lower bound) / 2. From the interval 97.06 to 102.94, MoE = (102.94 − 97.06) / 2 = 5.88 / 2 = 2.94. From 48.9% to 55.1%, MoE = (55.1 − 48.9) / 2 = 6.2 / 2 = 3.1 percentage points. Either direction, the two numbers carry the same information — one as a radius, one as a span.
Margin of Error vs Confidence Interval Example: A Mean
Example — a mean. A sample of n = 100 test scores has a mean of 100 and a population standard deviation of σ = 15. What is the margin of error, and what is the 95% confidence interval?
Step 1 — Find the standard error. SE = σ / √n = 15 / √100 = 15 / 10 = 1.50.
Step 2 — Multiply by the critical value. At 95% confidence, z* = 1.96, so MoE = 1.96 × 1.50 = 2.94.
Step 3 — Build the confidence interval. 100 − 2.94 = 97.06 and 100 + 2.94 = 102.94. The mean is reported as 100 ± 2.94, with a 95% confidence interval of 97.06 to 102.94.
Check the relationship: the interval is 102.94 − 97.06 = 5.88 wide, and 5.88 = 2 × 2.94. The same three steps work for any mean — a mean height, a mean income, a mean reaction time — provided the sample is large enough for the normal approximation (usually n ≥ 30) or the data are roughly normal. If you need σ itself, start with our standard deviation calculator and our guide to how to calculate standard deviation.
Margin of Error vs Confidence Interval Example: A Proportion
Example — a proportion. A survey of n = 1,000 voters finds that 52% support a proposal. What is the margin of error at 95% confidence, and what is the interval?
Step 1 — Find the standard error. SE = √(p(1 − p) / n) = √(0.52 × 0.48 / 1,000) = √(0.2496 / 1,000) = √0.0002496 = 0.0158.
Step 2 — Multiply by the critical value. At 95% confidence, z* = 1.96, so MoE = 1.96 × 0.0158 = 0.0310 = ±3.1%.
Step 3 — Build the confidence interval. 52% − 3.1% = 48.9% and 52% + 3.1% = 55.1%. The result is reported as "52% ± 3.1%," with a 95% confidence interval of 48.9% to 55.1%.
Again the width check: 55.1 − 48.9 = 6.2 percentage points, which is 2 × 3.1. And notice what the numbers mean in practice: because the interval 48.9%–55.1% straddles 50%, this poll cannot say whether a majority supports the proposal. A result of 52% with a ±3.1% margin of error is a statistical dead heat, and any headline claiming a lead would be wrong.
How Sample Size Shrinks Both: The 1/√n Rule
The margin of error shrinks with the square root of the sample size, not with the sample size itself — and because the interval is twice the margin of error, the interval shrinks at exactly the same rate. Quadrupling the sample halves both the margin of error and the width of the confidence interval.
| Sample size (n) | MoE at 95% (p = 0.5) | 95% CI width |
|---|---|---|
| 100 | ±9.8% | 19.6 points |
| 400 | ±4.9% | 9.8 points |
| 1,600 | ±2.45% | 4.9 points |
| 10,000 | ±0.98% | 1.96 points |
This is why going from 100 to 400 respondents is a huge improvement (9.8% to 4.9%), while going from 1,600 to 10,000 buys only about 1.5 percentage points. Past about 1,000 respondents, each extra respondent buys less and less precision — which is why most professional polls stop near 1,000–1,500.
How to Reduce the Margin of Error
There are only three ways to reduce the margin of error, and each one has a price:
- Increase the sample size. The honest way: quadrupling n halves the margin of error and the interval width. It costs time and money, and the returns diminish fast.
- Accept a lower confidence level. Dropping from 95% to 90% cuts z* from 1.96 to 1.645 and shrinks the margin of error by about 16% — but the interval is now less sure of catching the truth. A narrower interval bought this way is not "better"; it is just less confident.
- Reduce the spread of the data. A less variable population gives a smaller standard error. In practice this means measuring more precisely or studying a more homogeneous group — often not an option.
To plan a sample size before you survey, rearrange the proportion formula: n = (z*² × p(1 − p)) / E², where E is the margin of error you will accept as a decimal. For a ±3% margin of error at 95% confidence (using p = 0.5, the cautious choice that gives the largest sample): n = (1.96² × 0.25) / 0.03² = 0.9604 / 0.0009 = 1,067.1, so you need 1,068 respondents. For ±5%: n = 0.9604 / 0.05² = 0.9604 / 0.0025 = 384.16, so about 384 respondents. Run the numbers first with our margin of error calculator before you pay for interviews.
Margin of Error vs Confidence Level
Higher confidence makes the margin of error bigger — and the interval wider — never smaller. At 90% confidence z* = 1.645, at 95% z* = 1.96, and at 99% z* = 2.58. Because the margin of error is z* times the standard error, raising the confidence level stretches the interval. For the same survey of 1,000 voters at 52%:
| Confidence level | z* | MoE | Confidence interval |
|---|---|---|---|
| 90% | 1.645 | ±2.6% | 49.4% to 54.6% |
| 95% | 1.96 | ±3.1% | 48.9% to 55.1% |
| 99% | 2.58 | ±4.1% | 47.9% to 56.1% |
There is no free lunch: you pay for extra confidence with extra width, and you pay for a narrower interval with a bigger sample. A 99% interval is more likely to contain the truth than a 95% one, but it is also wider — and a wider interval says less. Choose the confidence level first (95% is the default in almost all reporting), then live with the width it gives, or enlarge the sample.
The standard error is the raw wobble of the estimate from sample to sample (0.0158 in the 52% poll); the margin of error is that wobble stretched by the critical value (1.96 × 0.0158 = 0.0310). The standard error depends only on the data; the margin of error also depends on the confidence level you choose. Two polls with the same standard error have different margins of error if one reports 90% confidence and the other 99% — and different intervals to match.
In short: the standard error is how noisy the estimate is; the margin of error is how wide an interval you need to be that confident. The confusion between a known and an estimated standard deviation is the same one behind population vs sample standard deviation: use σ when you know it, s when you are estimating it from the sample.
What Does a 95% Confidence Interval Mean?
It means the method works 95% of the time — not that this interval has a 95% chance of containing the truth. If the same survey were repeated many times, about 95 out of 100 of the intervals built this way would contain the true population value. The 95% describes the method, not this one result. Once the interval is built — 48.9% to 55.1%, say — the true value is either inside it or it is not; there is no probability left to assign to this particular interval.
It is worth stating plainly: a 95% confidence interval does not mean "there is a 95% probability the true value is inside this interval." It means that 95% is the long-run capture rate of the procedure that produced it. If you want a probability about this one interval, you want a Bayesian credible interval, which is a different calculation with a different meaning.
Do Overlapping Confidence Intervals Mean No Difference?
No. Two confidence intervals can overlap and the difference between the groups can still be statistically significant. Overlapping intervals do not prove there is no difference — they only show that each estimate is uncertain on its own. Whether the difference is significant depends on the standard error of the difference, which is smaller than the sum of the two separate uncertainties.
Take two polls of 1,000 voters each. Poll A finds 52% support (95% CI 48.9% to 55.1%); Poll B finds 47% (95% CI 43.9% to 50.1%). The intervals overlap from 48.9% to 50.1% — yet the difference, 5 percentage points, has a standard error of √(0.0158² + 0.0158²) = 0.0223, giving z = 0.05 / 0.0223 = 2.24, which clears 1.96. The difference is significant at 95% confidence even though the intervals overlap. The safe rule: never judge a difference by eyeballing overlap. Compare the difference and its own interval, or run the test.
When to Report the Margin of Error, and When the Interval?
Report the margin of error when you want a single number for precision: "52% ± 3.1%" fits in a headline and tells the reader how far off the estimate might be. Report the confidence interval when you want the reader to see the plausible range: "48.9% to 55.1%" shows at a glance whether the interval straddles a meaningful threshold such as 50%. Polls use the margin of error; scientific papers usually report the interval. Neither is wrong — they are the same information in two shapes, and a careful reader can convert one into the other with the steps above.
One distinction matters for this site: this page compares the margin of error with the confidence interval. Our empirical rule vs confidence interval guide compares something else — the empirical rule (68-95-99.7) with the confidence interval — and explains where intervals come from. The 68-95-99.7 pattern behind it is the empirical rule itself.
Frequently Asked Questions
What is a confidence interval?
A confidence interval is a range of plausible values for a population value, built from a sample — the estimate plus and minus the margin of error. For a poll result of 52% with a margin of error of ±3.1% at 95% confidence, the interval is 48.9% to 55.1%. It is a range, not a single number, and the margin of error is its radius.
How do you find the margin of error from a confidence interval?
Subtract the lower bound from the upper bound and halve the result: MoE = (upper − lower) / 2. For the interval 97.06 to 102.94, MoE = (102.94 − 97.06) / 2 = 5.88 / 2 = 2.94. For 48.9% to 55.1%, MoE = 6.2 / 2 = 3.1 percentage points.
What is the margin of error formula?
MoE = z* × SE. For a proportion, MoE = z* × √(p(1 − p) / n); for a mean, MoE = z* × (σ / √n). At 95% confidence z* = 1.96. Then add and subtract the result from the estimate to get the confidence interval.
What is the confidence interval formula?
CI = estimate ± MoE, which is CI = estimate ± z* × SE. For a mean: sample mean ± z* × (σ / √n). For a proportion: sample proportion ± z* × √(p(1 − p) / n). The interval is always two numbers — a lower and an upper bound — plus the confidence level.
What is the difference between margin of error and standard error?
The standard error measures how much the estimate wobbles from sample to sample; the margin of error is the standard error multiplied by the critical value for your confidence level. The standard error depends only on the data, while the margin of error also depends on the confidence level.
How many people do I need for a margin of error of ±3%?
At 95% confidence, 1,068 respondents (using p = 0.5). For ±5% you need 384. The formula is n = (z*² × p(1 − p)) / E².
Does a bigger sample always give a narrower confidence interval?
Yes, if the confidence level stays the same — a bigger sample shrinks the standard error, which shrinks the margin of error, which narrows the interval. Quadrupling the sample halves the width. But a bigger sample is not the only way to narrow an interval: lowering the confidence level narrows it too, at the cost of being less sure.
What is a good margin of error?
±1–3% is excellent, ±3–5% is good and is the standard for most polls, ±5–10% is acceptable for small studies, and more than ±10% is weak. Judge it against the size of the difference you need to detect: a ±3% poll can tell candidates apart when they are 8 points apart, but not when they are 2 points apart.
Check Tools
Margin of Error Calculator
Find the margin of error and the confidence interval for a survey result or a mean.
ToolsTry Calculator →● LiveEmpirical Rule Confidence Interval Calculator
Build a confidence interval from a mean and standard deviation with the empirical rule.
ToolsTry Calculator →● LiveConfidence Interval from Mean and Standard Deviation Calculator
Find a confidence interval for a mean, with z or t, from a mean and standard deviation.
ToolsTry Calculator →● LiveZ-Score Calculator
Convert any value to a z-score, or turn a z-score back into a raw value.
ToolsTry Calculator →● LiveStandard Deviation Calculator
Calculate the mean, variance, population standard deviation (σ) and sample standard deviation (s) for any data set.
ToolsTry Calculator →● LiveExplore All Statistical Tools
Browse the complete collection of free statistical tools and calculators on one page.
ToolsTry Calculator →Check Articles
What Is Margin of Error
It is the ± number printed after a survey result — the radius of the confidence interval around that result.
ArticleRead Article →● LiveHow to Calculate Standard Deviation
How to calculate standard deviation: find the mean, subtract the mean from each value and square each result, add the squared deviations, then divide by N for a population (or by n − 1 for a sample) and take the square root.
ArticleRead Article →● LivePopulation vs Sample Standard Deviation
Population vs sample standard deviation is the difference between describing a whole group and describing just part of it.
ArticleRead Article →● LiveHow to Calculate a Z-Score
Learning how to calculate a z score is the key to reading any normal distribution.
ArticleRead Article →● LiveWhat is the Empirical Rule?
It is the statistical rule, also called the 68-95-99.7 rule, that in a normal distribution 68.27% of values lie within one standard deviation of the mean, 95.45% within two standard deviations and 99.73% within three.
ArticleRead Article →● LiveEmpirical Rule vs. Confidence Intervals: What’s the Difference?
The empirical rule describes data: in a normal population, 68.27% of values fall within ±1σ, 95.45% within ±2σ and 99.73% within ±3σ of the mean.
ArticleRead Article →