Empirical Rule Practice Problems
If you want empirical rule practice problems with answers you can actually check, you are in the right place. This page works through 12 problems step by step, from the basic 68–95–99.7 bands to z-scores, percentiles and outliers, so you can see exactly how each answer is found. Every answer is given to two decimal places next to the rounded rule, and you can check your own working with our free tools as you go.
Short answer: these empirical rule practice problems cover the 68–95–99.7 rule with exact answers — 68.27% of values fall within one standard deviation, 95.45% within two and 99.73% within three. Each of the 12 problems below shows every step, including the z-score, so you can check your own working.
What Is the Empirical Rule Formula?
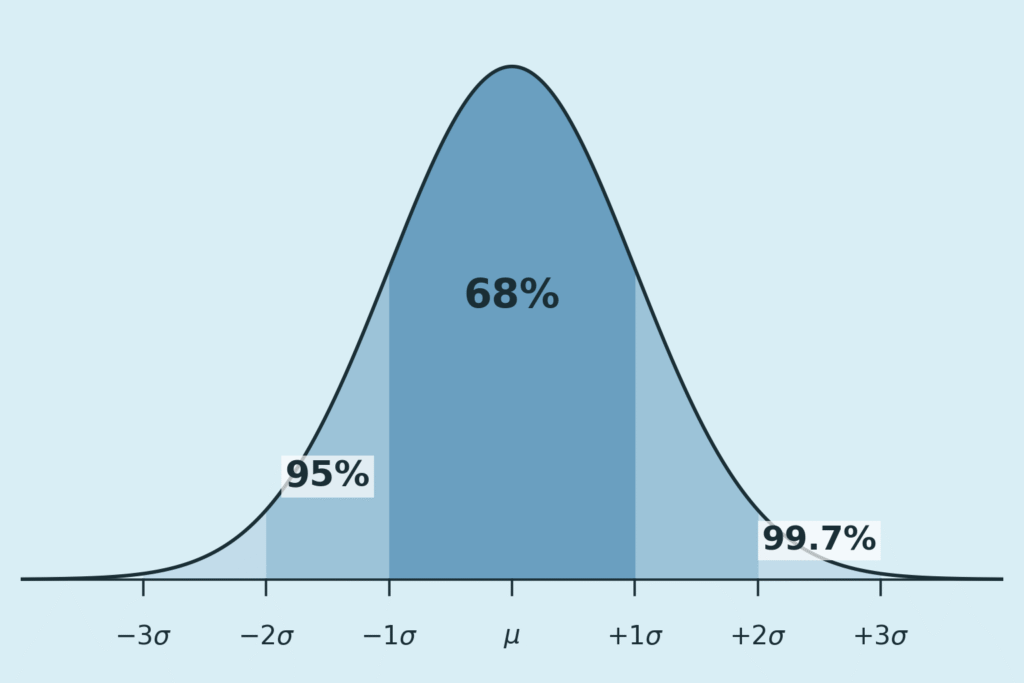
The empirical rule, also called the 68–95–99.7 rule, describes a normal distribution. If a value X is normal with mean μ and standard deviation σ, then:
- μ ± 1σ contains 68.27% of values (34.13% on each side of the mean).
- μ ± 2σ contains 95.45% of values (13.59% in each band from 1σ to 2σ).
- μ ± 3σ contains 99.73% of values (2.14% in each band from 2σ to 3σ).
- Only 0.27% of values lie beyond 3σ — 0.13% in each tail.
Read the full background in our guide to what the empirical rule is, or jump straight to the problems below. The authoritative reference for the normal distribution is the NIST/SEMATECH e-Handbook of Statistical Methods.
How to Solve Empirical Rule Problems
Use the same five steps for every problem on this page:
- Write down the mean (μ) and the standard deviation (σ). Every problem gives you these two numbers.
- Turn each value into a z-score with z = (x − μ) ÷ σ. A z-score says how many standard deviations a value sits from the mean.
- Read the area from the z-table — or use the 68.27%, 95.45% and 99.73% bands when the value sits exactly 1, 2 or 3 standard deviations out.
- For a range, subtract the two areas; for a tail, take half of what is left outside. The curve is symmetric, so each tail holds half of the outside area.
- Check your answer with a calculator before you trust it — a small slip in the z-score changes everything.
Empirical Rule Practice Problems with Answers
Work through each problem in order. Cover the answer, try it yourself with the five steps above, then check the worked solution. Every solution shows the z-score and the exact two-decimal answer next to the rounded rule.
Group A — The Rule: One Standard Deviation
Problem 1. IQ scores are normally distributed with a mean of 100 and a standard deviation of 15. What percentage of people have an IQ between 85 and 115?
Solution. Step 1: μ = 100, σ = 15. Step 2: z = (85 − 100) ÷ 15 = −1.00 and z = (115 − 100) ÷ 15 = +1.00. Step 3: the values sit exactly one standard deviation from the mean, so the empirical rule applies directly. Step 4: the area between z = −1 and z = +1 is 68.27%.
Answer: 68.27% (about 68%). Check it on the IQ bell curve calculator.
Problem 2. Test scores are normally distributed with a mean of 70 and a standard deviation of 10. What percentage of students score between 60 and 80?
Solution. z = (60 − 70) ÷ 10 = −1.00 and z = (80 − 70) ÷ 10 = +1.00. This is the μ ± 1σ band, so the area is 68.27%.
Answer: 68.27% (about 68%).
Group B — Tails: Beyond Two Standard Deviations
Problem 3. With IQ scores (μ = 100, σ = 15), what percentage of people score above 130?
Solution. z = (130 − 100) ÷ 15 = +2.00. The area beyond z = +2 is half of what lies outside μ ± 2σ: (100% − 95.45%) ÷ 2 = 2.28%.
Answer: 2.28%.
Problem 4. With the same IQ distribution, what percentage of people score below 70?
Solution. z = (70 − 100) ÷ 15 = −2.00. By symmetry, the lower tail beyond z = −2 is the same as the upper tail: (100% − 95.45%) ÷ 2 = 2.28%.
Answer: 2.28%.
Group C — The Trap: 90 to 110 Is Not 68%
Problem 5. With IQ scores (μ = 100, σ = 15), what percentage of people score between 90 and 110?
Solution. z = (90 − 100) ÷ 15 = −0.67 and z = (110 − 100) ÷ 15 = +0.67 (more precisely ±0.6667). This is NOT the 68% band — the 68% band is 85 to 115. From the z-table, Φ(0.6667) = 0.7475, so the area between the two values is 0.7475 − 0.2525 = 0.4950.
Answer: 49.50%. Many students answer 68% here. Remember: 68% only covers μ ± 1σ, and 90 to 110 is only ±0.67σ.
Group D — Z-Scores and Percentiles
Problem 6. Test scores are normally distributed with a mean of 70 and a standard deviation of 10. A student scores 85. What is the z-score and the percentile? A second student scores 55. What is the z-score and the percentile?
Solution. For 85: z = (85 − 70) ÷ 10 = +1.50. Φ(1.50) = 0.9332, so the student is at the 93.32nd percentile. For 55: z = (55 − 70) ÷ 10 = −1.50. Φ(−1.50) = 0.0668, so the student is at the 6.68th percentile.
Answer: score 85 → z = +1.50, 93.32nd percentile; score 55 → z = −1.50, 6.68th percentile. Try it on the z-score calculator.
Problem 7. IQ scores are normally distributed with μ = 100 and σ = 15. (a) What IQ is at the 90th percentile? (b) What percentile is an IQ of 130?
Solution. (a) The 90th percentile has z = +1.28. x = μ + zσ = 100 + 1.28 × 15 = 119.22 (using z = 1.2816). (b) For x = 130: z = (130 − 100) ÷ 15 = +2.00. Φ(2.00) = 0.9772, so the score is at the 97.72nd percentile.
Answer: (a) IQ 119.22; (b) 97.72nd percentile. Check it with the percentile calculator.
Group E — Middle Ranges
Problem 8. Test scores are normally distributed with a mean of 70 and a standard deviation of 10. (a) Between which two scores do the middle 95% of students fall? (b) Between which two scores do the middle 99.7% fall?
Solution. (a) The middle 95% is μ ± 2σ = 70 ± 20, so 50 to 90. (b) The middle 99.7% is μ ± 3σ = 70 ± 30, so 40 to 100.
Answer: (a) 50–90; (b) 40–100.
Group F — Real Life: Heights and Weights
Problem 9. The heights of adult women are normally distributed with a mean of 64 inches and a standard deviation of 2.5 inches. Find (a) P(59 < X < 69), (b) P(X > 66.5) and (c) P(X < 56.5).
Solution. (a) z = (59 − 64) ÷ 2.5 = −2.00 and z = (69 − 64) ÷ 2.5 = +2.00, so the area is 95.45%. (b) z = (66.5 − 64) ÷ 2.5 = +1.00. The upper tail beyond z = +1 is (100% − 68.27%) ÷ 2 = 15.87%. (c) z = (56.5 − 64) ÷ 2.5 = −3.00. The lower tail beyond z = −3 is (100% − 99.73%) ÷ 2 = 0.13%.
Answer: (a) 95.45%; (b) 15.87%; (c) 0.13%. Verify the range with the probability finder.
Problem 10. Adult weights are normally distributed with a mean of 160 lb and a standard deviation of 20 lb. What percentage of adults weigh less than 140 lb?
Solution. z = (140 − 160) ÷ 20 = −1.00. The tail below z = −1 is (100% − 68.27%) ÷ 2 = 15.87%.
Answer: 15.87%. Note: one popular worksheet answers this as about 34% — that is wrong. 34.13% is the slice between 140 and 160 (z = −1 to z = 0), not the tail below 140. The tail is only half of the 31.73% outside μ ± 1σ, which is 15.87%. Check it with the tail probability calculator.
Group G — Outliers
Problem 11. Test scores are normally distributed with a mean of 70 and a standard deviation of 10. (a) Is a score of 105 an outlier by the 3σ rule? (b) What about a score of 100?
Solution. (a) z = (105 − 70) ÷ 10 = +3.50. Only 0.02% of scores sit above z = +3.50, so 105 is an outlier — it lies well beyond 3σ. (b) z = (100 − 70) ÷ 10 = +3.00. Only 0.135% of scores sit above z = +3.00, so 100 is borderline: it sits exactly on the 3σ line.
Answer: (a) yes, z = +3.50, 0.02% above — an outlier; (b) borderline, z = +3.00, 0.135% above. Test any value with the outlier detector.
Group H — Working Backwards
Problem 12. A class mean is 21. If 47.72% of students scored between 15 and 21, what is the standard deviation? A scholarship goes to students with a z-score of 3.0 or more. What is the minimum score, and what share of students is offered the scholarship?
Solution. 47.72% is the area from the mean to z = −2 (50% − 2.28% = 47.72%), so 15 sits 2σ below the mean: 2σ = 21 − 15 = 6, so σ = 3. The scholarship minimum is x = 21 + 3 × 3 = 30. The share offered is the tail beyond z = +3, which is 0.13%.
Answer: σ = 3; minimum score 30; 0.13% of students are offered the scholarship.
Common Mistakes with the Empirical Rule
Three slips cause most wrong answers. First, the 68% vs 34% half-band mistake: 34.13% is the area from the mean to +1σ — half of the 68.27% band — not the whole band. A tail beyond 1σ is 15.87%, not 34%. Second, rounding: 68.27% rounds to 68%, but the exact value matters when a question asks for two decimal places, as in Problem 5. Third, forgetting that a tail is half the outside area: the area beyond z = +2 is (100% − 95.45%) ÷ 2 = 2.28%, not 4.55%.
Keep the bell curve picture in mind: the diagram above shows where each percentage sits. If your answer ever exceeds 100%, or a one-sided tail comes out above 50%, recheck the z-score first.
How to Check Your Answers
Every problem type on this page maps to a free tool. Use the bell curve generator to draw the distribution for any mean and standard deviation, then check ranges with the probability finder, tails with the tail probability calculator, percentiles with the percentile calculator, and z-scores with the z-score calculator. For the outlier problems, run the value through the outlier detector. If the tool and your hand working disagree, redo the z-score — that is where the error almost always is. See all our free statistics tools on one page.
What Percentage Is Within 1 Standard Deviation?
68.27% of values fall within one standard deviation of the mean (about 68% when rounded). Half of that, 34.13%, sits on each side of the mean. So for IQ scores with μ = 100 and σ = 15, 68.27% of people score between 85 and 115 — see Problem 1 above.
How to Find the Percentage Between Two Values Using the Empirical Rule
Turn both values into z-scores with z = (x − μ) ÷ σ, look up each z-score’s area in the z-table, and subtract the smaller area from the larger one. If both values sit exactly 1, 2 or 3 standard deviations out, use the 68.27%, 95.45% or 99.73% bands instead. Problem 5 shows the full working for IQ scores between 90 and 110.
Frequently Asked Questions
How do you use the empirical rule step by step?
Write down μ and σ, turn each value into a z-score with z = (x − μ) ÷ σ, read the area from the z-table or the 68.27 / 95.45 / 99.73 bands, subtract areas for a range or halve the outside area for a tail, then check the answer with a calculator. The five steps at the top of this page show the method in full.
How do you solve empirical rule problems with IQ scores?
Use μ = 100 and σ = 15, the standard IQ mean and standard deviation. Convert each IQ to a z-score, then read the area. For example, an IQ of 130 is z = +2.00, so 2.28% of people score above it — see Problems 1, 3 and 7.
How do you solve empirical rule outlier problems?
Find the z-score. A value more than 3 standard deviations from the mean (z beyond ±3.00) is an outlier by the 3σ rule. A score of 105 with μ = 70 and σ = 10 has z = +3.50, so it is an outlier; a score of 100 has z = +3.00, exactly on the line — see Problem 11.
What percentage is within 2 standard deviations?
95.45% of values fall within two standard deviations of the mean (about 95% rounded). Only 4.55% lie outside, split evenly as 2.28% in each tail.
What percentage is between 1 and 2 standard deviations?
13.59% on each side. Between z = +1 and z = +2 is 13.59%, and the same on the negative side, so 27.18% of values sit between 1 and 2 standard deviations from the mean in total.
How many standard deviations is an outlier?
More than 3 standard deviations from the mean. Under the empirical rule, 99.73% of values lie within μ ± 3σ, so anything beyond that is rare enough to count as an outlier — about 0.27% of all values.
When does the empirical rule not apply?
Only to data that is approximately normally distributed — a bell-shaped, symmetric distribution. If the data is skewed, bimodal or has heavy tails, use the actual distribution or Chebyshev’s inequality instead of the 68–95–99.7 rule.
Why is 68% not the exact answer?
68% is the rounded rule. The exact area within one standard deviation is 68.27%. The difference is small, but it matters for two-decimal answers and for tails: the exact tail beyond z = +1 is 15.87%, not 16%.
Check Tools
Check any answer on this page with the matching free tool:
Bell Curve Generator
Draw the bell curve for any mean and standard deviation — use it for Problems 1–5 and 8.
Z-Score Calculator
Turn any score into a z-score and a percentile — use it for Problems 6, 7 and 11.
Empirical Rule Probability Finder
Find the percentage between two values — use it for Problems 5 and 9.
Empirical Rule Percentile Calculator
Convert scores to percentiles and back — use it for Problems 6 and 7.
Left/Right Tail Probability Calculator
Find one-sided tail areas — use it for Problems 3, 4 and 10.
IQ Bell Curve Calculator
Check IQ scores against the IQ bell curve — use it for Problems 1, 3, 4 and 5.
Empirical Rule Outlier Detector
Test whether a value is an outlier — use it for Problem 11.
Explore All Statistical Tools
Browse every free statistics tool on this site in one place.