
IQ Bell Curve Explained
An IQ score is only a number until you know where it sits. The IQ bell curve — the normal distribution with a mean of 100 and a standard deviation of 15 that the Wechsler scales use — turns that number into a percentile, a band and a statement about rarity. This guide explains why IQ is set at 100, what the Wechsler bands mean, and where your score really sits.
The IQ bell curve is a normal distribution with a mean of 100 and a standard deviation of 15 — engineered that way by test publishers, not discovered in nature. An IQ of 115 sits at the 84.13th percentile, the top of the High Average band; 130 is the 97.72nd percentile, the start of Very Superior and the gifted threshold.
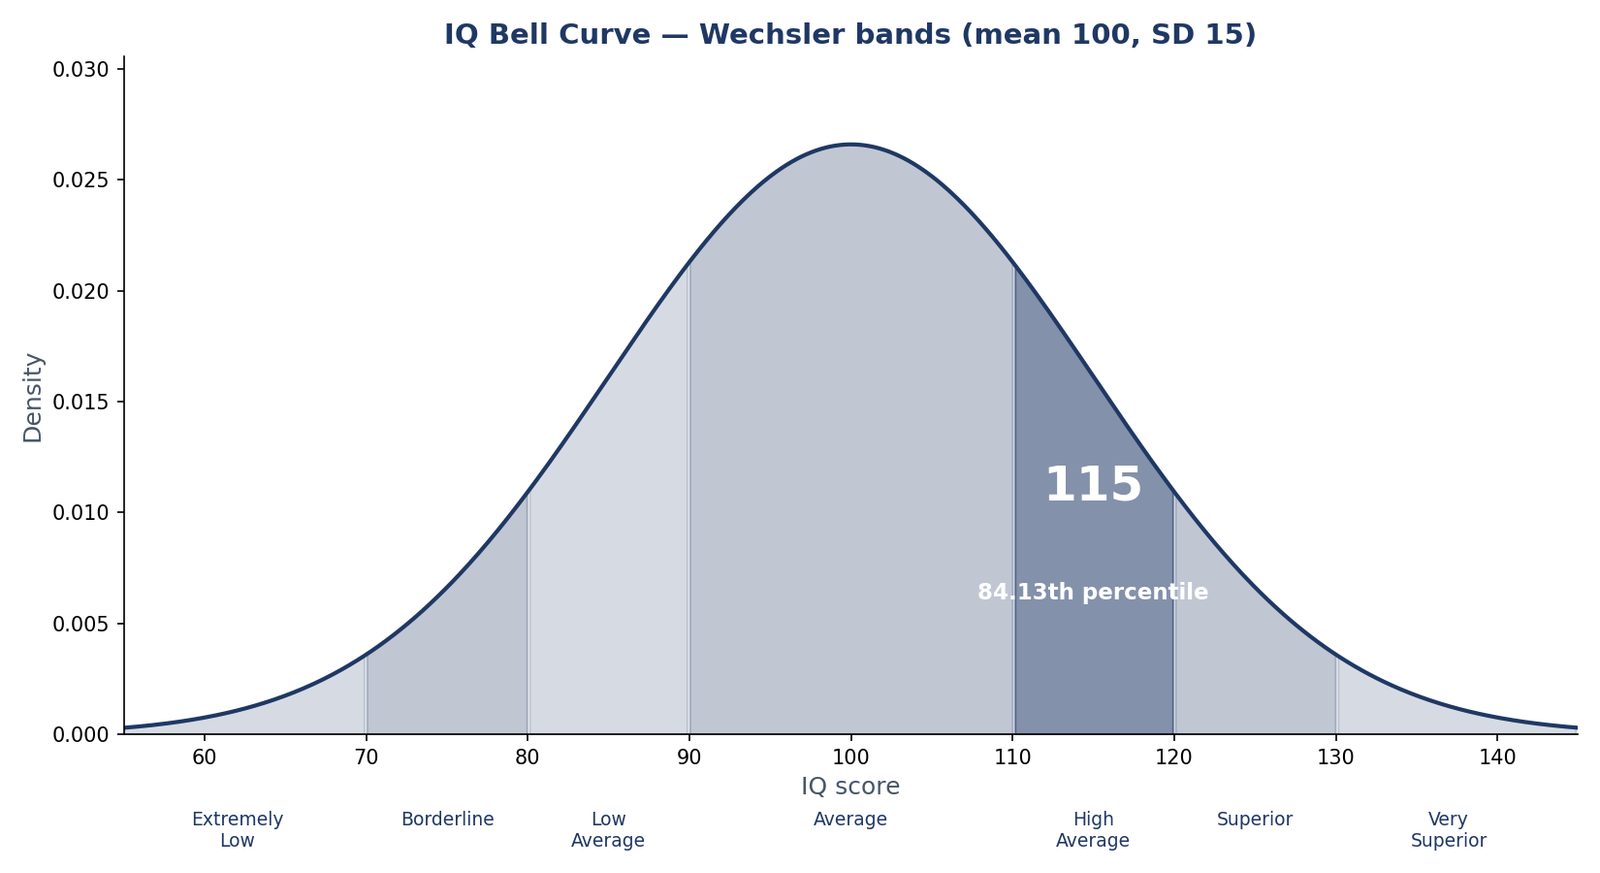
The IQ bell curve (mean 100, SD 15) with the Wechsler bands. An IQ of 115 sits at the 84.13th percentile — the top of High Average.
What Is the IQ Bell Curve?
The IQ bell curve is the graph of a normal distribution with a mean of 100 and a standard deviation of 15. Every IQ score is a point on that curve: 100 sits at the peak, 115 sits one standard deviation above the mean, and 85 sits one standard deviation below it. Because the curve is a normal distribution, the percentile of any IQ score follows directly from how many standard deviations it is from 100.
That is the whole idea of a deviation IQ. A test publisher does not count correct answers and call the total an IQ. Instead, it standardises the raw score — how many questions you answered correctly — into a z-score, then stretches it onto the IQ scale with one formula:
IQ = 100 + 15 × z
Here z is the number of standard deviations your raw score sits from the mean of the standardisation sample. If you scored 1.5 standard deviations above the sample mean, your IQ is 100 + 15 × 1.5 = 122.5, reported as 123. The IQ bell curve calculator does this conversion in both directions — enter an IQ to get its percentile, or enter a percentile to get the IQ.
A concrete example makes the bridge clear. Suppose a test’s standardisation sample answered a mean of 60 questions correctly with a standard deviation of 10. A raw score of 75 is z = (75 − 60) / 10 = +1.5, so the deviation IQ is 100 + 15 × 1.5 = 122.5, rounded to 123. The same raw score on a different test, with a different mean and standard deviation, would give a different IQ — which is why a raw score on its own tells you almost nothing. The z-score is the bridge between the raw score and the IQ.
The crucial point is that the curve is engineered, not discovered. Test publishers chose 100 and 15 deliberately, then normed their tests so that scores fall on that curve. The U.S. National Institute of Standards and Technology describes the normal distribution the IQ scale is forced into — but nature did not hand us a bell curve of intelligence. The publishers built one, and the 68-95-99.7 rule follows from the construction: about 68% of people score between 85 and 115, about 95% between 70 and 130, and about 99.7% between 55 and 145.
Why Is the Average IQ Exactly 100?
Because someone chose it. The average IQ is 100 by design, not by discovery. In 1912, the German psychologist William Stern proposed the intelligence quotient as a ratio: mental age divided by chronological age, multiplied by 100. A child whose mental age matched their chronological age scored exactly 100. Lewis Terman adopted the ratio for the Stanford-Binet test in 1916, and 100 became the anchor of the whole scale.
The ratio had a problem: it stops making sense for adults, whose mental age does not keep growing with chronological age. In 1939, David Wechsler replaced the ratio with the deviation IQ we still use — IQ = 100 + 15z — keeping 100 as the anchor but defining the scale by position in a normal distribution instead of by age. The number 100 stayed; the meaning underneath it changed completely.
Keeping 100 as the mean is what makes the scale usable. Every score is read as a distance from 100 in units of 15: 115 is one standard deviation above average, 85 is one below, and 70 is two below. If the anchor were 0, half the population would have negative IQs; if it were 500, like the SAT, the numbers would feel like test marks rather than a position in a population. A hundred is a round, familiar centre — and because the scale is a standardised one, an IQ of 100 always means “exactly average”, on any test, in any year.
That “in any year” needs a mechanism: norming. A test publisher standardises a new test on a representative sample — for the WAIS-IV, about 2,200 adults matched to the U.S. census on age, sex, race, education and region — and sets the raw-score-to-IQ conversion so that the sample’s mean raw score becomes IQ 100 and its standard deviation becomes 15 IQ points. The norming happens in four steps: draw the representative sample, administer the test, compute the sample mean and standard deviation of raw scores, and fix the conversion table. Your IQ is therefore always a comparison with the people the test was normed on, not an absolute measure of anything in your head — just as GRE and ACT percentiles are always relative to the test-takers of a given year.
This is also why IQ scores are re-normed every decade or two. As the population changes, the old conversion table drifts, and a score of 100 on an old test no longer means “average” against today’s population. The bell curve behind the scale stays the same shape — mean 100, standard deviation 15 — but the raw scores that map onto it are re-anchored. The Flynn effect section below explains what happens when that re-anchoring is skipped.
The Wechsler Bands: What Each IQ Range Means
The Wechsler scales do not just give you a number — they sort every score into a named band. These are the official Wechsler classification bands, with the exact percentile range each one covers. The boundaries are the IQ scores themselves; the percentiles follow from the normal curve.
| Wechsler band | IQ range | Percentile range |
|---|---|---|
| Extremely Low | Below 70 | Below the 2.28th |
| Borderline | 70–79 | 2.28th–9.12th |
| Low Average | 80–89 | 9.12th–25.25th |
| Average | 90–109 | 25.25th–72.57th |
| High Average | 110–119 | 72.57th–89.74th |
| Superior | 120–129 | 89.74th–97.34th |
| Very Superior | 130 and above | 97.72nd and above |
Two things about this table surprise most people. First, the Average band is wide — it covers nearly half the population (90–109), because the normal curve is densest near the mean. Second, the bands are not equal in width: Extremely Low has no lower bound, and Very Superior has no upper bound, because the curve has tails that stretch indefinitely. A score of 130 is the 97.72nd percentile, which means about 2.3 people in 100 score that high or higher — roughly 1 in 44.
Notice also that the band edges are the round IQ numbers, not round percentiles. The boundary between High Average and Superior is IQ 120 — the 89.74th percentile, not the 90th. The 90th percentile itself is IQ 119.22, which sits inside High Average. And 115 is the top of High Average (110–119), not the bottom of Superior — a mistake even confident test-takers make. You can check any score against the bands with the IQ bell curve calculator, which reports the band, the percentile and the rarity together.
Is an IQ of 115 Good?
Yes — an IQ of 115 is a strong score. It sits at the 84.13th percentile, which means you scored higher than about 84 people in 100. On the Wechsler bands it is the top of High Average (110–119): one point higher and you would be in Superior. In everyday terms, 115 is the score a selective university or a competitive graduate programme would be happy to see — but it is not the rare, top-2% territory that starts at 130.
The number to keep in mind is the distance from 100. At 115 you are exactly one standard deviation above the mean (z = +1.00), and the normal curve puts one standard deviation above the mean at the 84.13th percentile. The same arithmetic gives the other landmarks: the 90th percentile is IQ 119.22, about 119; 130 is the 97.72nd percentile; 145 is the 99.87th percentile. You can work any of these out with the z-score calculator — take z, multiply by 15, add 100 — or read them off the IQ bell curve calculator.
The catch is that “115” means something different on different tests, because not every IQ test uses a standard deviation of 15. The Wechsler scales use 15; the Stanford-Binet 5th edition uses 16; the Cattell Culture Fair test uses 24. The same percentile is a different IQ number on each scale:
| Percentile | Wechsler (SD 15) | Stanford-Binet 5 (SD 16) | Cattell (SD 24) |
|---|---|---|---|
| 50th | 100 | 100 | 100 |
| 84th | 115 | 116 | 124 |
| 90th | 119 | 121 | 131 |
| 98th | 131 | 133 | 149 |
| 99.87th | 145 | 148 | 172 |
The 98th-percentile row is the one that trips people up: 131 on a Wechsler test, 133 on Stanford-Binet and 149 on Cattell are the same standing in the population (z = +2.0537). A Cattell score of 148 looks spectacular next to a Wechsler 130, but it is the same percentile — the z = +2 point, the 97.72nd percentile. So whenever you compare IQ numbers from different tests, compare percentiles, never the raw IQs. The conversion is simple: z = (IQ − 100) / SD, then IQ on the new scale = 100 + z × (new SD).
How Rare Is an IQ of 145?
An IQ of 145 is the 99.87th percentile — about 1 person in 741 scores that high or higher. That is rare, but it is not the vanishing rarity people imagine: in a city of 100,000 people, roughly 135 of them would score 145 or above. The rarity grows brutally fast as you go higher, because the normal curve’s tail falls away exponentially:
| IQ (Wechsler) | z-score | Percentile | Rarity |
|---|---|---|---|
| 115 | +1.00 | 84.13th | 1 in 6 |
| 130 | +2.00 | 97.72nd | 1 in 44 |
| 131 | +2.05 | 98th | 1 in 50 (Mensa threshold) |
| 145 | +3.00 | 99.87th | 1 in 741 |
| 160 | +4.00 | 99.997th | 1 in 31,574 (model only) |
Two of these rows deserve a warning. First, the 98th percentile — IQ 130.8, about 131 — is the Mensa threshold: the top 2% of the population. Second, the 160 row is a model extrapolation, not a measurement. The normal curve says 1 in 31,574 people should score 160 or higher, but real IQ tests cannot measure that far out. Their ceilings sit around 145–160: above that, there are not enough hard items to separate a 160 from a 170, so scores bunch up at the ceiling and the test reports the maximum. The curve does not hold that far out — and the same is true at the low end, where there is a small excess of very low scores over what the normal curve predicts, because intellectual disability has specific causes (genetic conditions, birth injury, illness) that the smooth bell curve does not model.
That is the honest limit of the IQ bell curve: it is a superb model between about 70 and 145, and it degrades outside that range. If you want to know how rare your own score is, the IQ bell curve calculator gives the percentile and the “1 in N” rarity for any IQ — and if you want to see how the tail behaves, the empirical rule percentile calculator shows the same normal-curve arithmetic for any mean and standard deviation.
Does IQ Change Over Time? The Flynn Effect and the Error Bar
Yes — and in two different ways. The first is the Flynn effect: average IQ scores have risen by roughly 3 points per decade for most of the twentieth century (Flynn, 1987). Meta-analyses put the rate more precisely: Trahan and colleagues (2014) found 2.31 points per decade overall, and 2.93 per decade for modern Stanford-Binet and Wechsler tests since 1972; Pietschnig and Voracek (2015) found a full-scale gain of about 0.28 points per year. The rise is not fully explained — better nutrition, more schooling, more test-like thinking and smaller families all contribute — but its consequence is concrete: a person who scored 100 on norms from 1990 would score about 91 on norms from 2020, because the population they are compared with has moved on.
That is why tests are re-normed. Without re-norming, the whole bell curve would drift upward and “average” would stop meaning average. Re-norming re-anchors the conversion so that 100 stays the population mean. It also means that an old IQ score and a new IQ score are not directly comparable unless you know which norms each one used — a 100 from 1990 and a 100 from 2020 describe different raw performances.
The second way IQ changes is measurement error. No test measures perfectly. The Wechsler scales have a reliability of about 0.97, which gives a standard error of measurement (SEM) of about 2.6 IQ points. A reported score is therefore a best estimate with an error bar around it:
A reported IQ of 115 is really 112–118 at 68% confidence (±1 SEM) and 110–120 at 95% confidence (±2 SEM).
In practice, that means a 115 and a 118 are the same score within measurement error, and a 115 is not meaningfully different from a 112. It also means the band boundaries are fuzzy: a reported 119 could truly be a 121 (Superior) or a 117 (High Average). Responsible reports give a confidence interval, not just a number. If a report gives you a single number with no interval, ask for the interval.
What IQ Does NOT Measure
IQ tests measure a narrow slice of cognition — mainly abstract reasoning, working memory and processing speed — and they do it well. What they do not measure is almost everything else that matters: creativity, motivation, practical skill, emotional judgment, conscientiousness and school grades. A high IQ does not guarantee good grades, and a modest IQ does not prevent them; grades also depend on study habits, teaching quality and interest.
The honest summary of the evidence is that IQ predicts real outcomes but only partly. Schmidt and Hunter’s meta-analyses put the correlation between general mental ability and job performance at about r = 0.5 — real, substantial, and far from the whole story. Half the variance in job performance is not explained by IQ at all. The same pattern holds for income, health and education: IQ is one of the strongest single predictors psychologists have, and it is still only one predictor among many.
One boundary is worth stating plainly. The IQ bell curve describes variation within a population; it is silent on the causes of differences between groups, and this article takes no position on those debates. What the curve does tell you — for any individual, on any test — is where one score sits relative to the people that test was normed on. That is a precise, useful and limited claim, and it is the only claim this guide makes.
Frequently Asked Questions
Why is the average IQ exactly 100?
Because William Stern chose it. In 1912 Stern defined the intelligence quotient as mental age divided by chronological age, times 100 — so a child whose mental age matched their age scored exactly 100. David Wechsler kept 100 as the anchor when he replaced the ratio with the deviation IQ (IQ = 100 + 15z) in 1939. The number is a convention, not a discovery: 100 always means “exactly average” on the test’s norms.
What does an IQ of 115 mean?
An IQ of 115 is one standard deviation above the mean (z = +1.00), which puts it at the 84.13th percentile — higher than about 84 people in 100. On the Wechsler bands it is the top of High Average (110–119), one point below Superior. It is a strong score: selective universities and competitive graduate programmes would be happy to see it.
What IQ is the 90th percentile?
The 90th percentile is an IQ of 119.22, about 119 on the Wechsler scale — still inside the High Average band, since Superior starts at 120. On the Stanford-Binet 5 (SD 16) the 90th percentile is about 121, and on the Cattell test (SD 24) it is about 131. The percentile is the same on every scale; only the IQ number changes.
Is 130 a gifted IQ?
Yes. An IQ of 130 is the 97.72nd percentile — the top 2% of the population — and the start of the Wechsler Very Superior band. It is the usual threshold for gifted programmes and for Mensa, which admits the top 2% (an IQ of about 131, the 98th percentile, on the Wechsler scale). About 1 person in 44 scores 130 or higher.
How rare is an IQ of 145?
An IQ of 145 is the 99.87th percentile, about 1 person in 741. In a city of 100,000 people, roughly 135 would score 145 or higher. Scores above 145 are so rare that most tests cannot measure them precisely — their ceilings sit around 145–160, so a reported 150 is better read as “at or near the test’s ceiling” than as an exact measurement.
Why do different tests give different IQ numbers?
Because the tests use different standard deviations: 15 for Wechsler, 16 for Stanford-Binet 5 and 24 for Cattell. The same percentile is a different number on each scale — the 98th percentile is 131 on Wechsler, 133 on Stanford-Binet and 149 on Cattell. Always compare percentiles, not raw IQ numbers, and convert with z = (IQ − 100) / SD if you need to move between scales.
Does IQ change over time?
Yes, in two ways. Population averages rise by about 3 IQ points per decade (the Flynn effect), so a 100 on 1990 norms is about a 91 on 2020 norms — which is why tests are re-normed. And any single score has a measurement error of about ±2.6 points (the SEM), so a reported 115 is really 112–118 at 68% confidence. An individual’s score can shift by 10 points or more between testings, especially in childhood.
What does IQ NOT measure?
Creativity, motivation, practical skill, emotional judgment and school grades. IQ tests measure a narrow slice of cognition — mainly abstract reasoning, working memory and processing speed. The correlation with job performance is about r = 0.5 (Schmidt & Hunter): real and substantial, but far from the whole story. IQ is one of the strongest single predictors psychologists have, and it is still only one predictor among many.
Check Tools
Put the ideas on this page to work:
- IQ Bell Curve Calculator — Find the percentile, band and rarity of any IQ score.
- Z-Score Calculator — Turn any raw score into a z-score and a percentile.
- Empirical Rule Percentile Calculator — Convert between z-scores, percentiles and raw scores on any normal curve.
- Bell Curve Generator — Draw the IQ bell curve and move the mean and standard deviation.
- Test Score Percentile Calculator — See how GRE and ACT percentiles compare with the normal model.
Check Articles
Keep reading with these guides from the site:
What Is a Bell Curve?
The normal distribution behind the IQ scale, with the 68-95-99.7 rule.
Read What Is a Bell Curve? →
What Is a Raw Score?
How raw scores become z-scores and IQs.
Read What Is a Raw Score? →
How to Calculate a Z-Score
Turn any value into a z-score with the (x − μ) / σ formula.
Read How to Calculate a Z-Score →
Test Score Percentiles Explained
GRE and ACT percentiles: official tables vs the normal model.
Read Test Score Percentiles Explained →
What Is the Empirical Rule?
The 68-95-99.7 rule in full, with the exact percentages.
Read What Is the Empirical Rule? →
Chebyshev’s Theorem Explained
What the curve guarantees when the data is not normal.
Read Chebyshev’s Theorem Explained →