
Population vs sample standard deviation is the difference between describing a whole group and estimating it from part of the group. The population standard deviation (σ) divides by N, the number of values you have. The sample standard deviation (s) divides by n − 1, which makes it a little larger for the same data. The whole choice comes down to one question: do you have every value in the group, or only some of them? This guide gives you that one-question rule, both formulas, two worked examples, and four practice scenarios, so you never have to guess again. You can check any answer against our Standard Deviation Calculator, which shows both σ and s for the same data.
The confusion is understandable. Both measures use the same starting point, the mean, and the same sum of squared deviations. They differ in exactly one place: the number you divide by. That single difference changes the answer, changes what the number means, and changes which tools give you which value by default. Once you see why the divisor changes, the choice becomes automatic.
The One-Question Decision Rule
Ask yourself one question before you calculate anything: Do I have EVERY value in the group, or only SOME of them?
- Do you have the whole group? Use the population standard deviation and divide by N.
- Do you have only a sample? Use the sample standard deviation and divide by n - 1.
- Are you using the sample to estimate the population? Use the sample standard deviation and divide by n - 1.
That is the whole flowchart in three steps: whole group means population; sample means sample; estimating the population from a sample means sample. If you can answer the one question, you have already chosen the right formula. The rest of this page shows you why the rule works, what each formula does, and where people go wrong.
Population vs Sample Standard Deviation Formula
The population standard deviation formula and the sample standard deviation formula look almost identical. Both take the square root of the average squared distance from the mean. The only difference is the divisor.
| Population standard deviation | Sample standard deviation |
|---|---|
| σ = √( Σ(x − μ)² / N ) | s = √( Σ(x − x̄)² / (n − 1) ) |
In these formulas, σ is the population standard deviation and s is the sample standard deviation. The symbol μ is the population mean, x̄ is the sample mean, Σ means add up, x is each value, N is the number of values in the whole population, and n is the number of values in the sample. Both formulas follow the same steps: find the mean, subtract it from each value, square each deviation, add the squared deviations, divide, and take the square root. The step-by-step method is explained in our guide to calculating standard deviation.
Standard Deviation of a Sample vs Population
Here is the same comparison at a glance. The last row uses the worked example below, where the data are 10, 5, 20, 15 and 20.
| Population (σ) | Sample (s) | |
|---|---|---|
| Data used | Every value in the group | Only some values, a sample |
| Mean symbol | μ (population mean) | x̄ (sample mean) |
| Divide the sum of squared deviations by | N | n − 1 |
| What it describes | The spread of that exact group | An estimate of the population spread |
| Value for 10, 5, 20, 15, 20 | 5.83 | 6.52 |
Population Standard Deviation vs Sample Standard Deviation Example
Take the same five numbers and treat them both ways, so you can see exactly where the answers split apart: 10, 5, 20, 15, 20.
Step 1 — Find the mean. Add the values: 10 + 5 + 20 + 15 + 20 = 70. Divide by 5: 70 ÷ 5 = 14. The mean is 14.
| Value (x) | Deviation (x − 14) | Squared deviation |
|---|---|---|
| 10 | −4 | 16 |
| 5 | −9 | 81 |
| 20 | +6 | 36 |
| 15 | +1 | 1 |
| 20 | +6 | 36 |
Step 2 — Add the squared deviations. 16 + 81 + 36 + 1 + 36 = 170. This sum, 170, is the same for both versions. A useful check: the deviations −4, −9, +6, +1 and +6 add up to 0, as they always must.
Population: variance = 170 ÷ 5 = 34.00, so σ = √34.00 = 5.83.
Sample: variance = 170 ÷ 4 = 42.50, so s = √42.50 = 6.52.
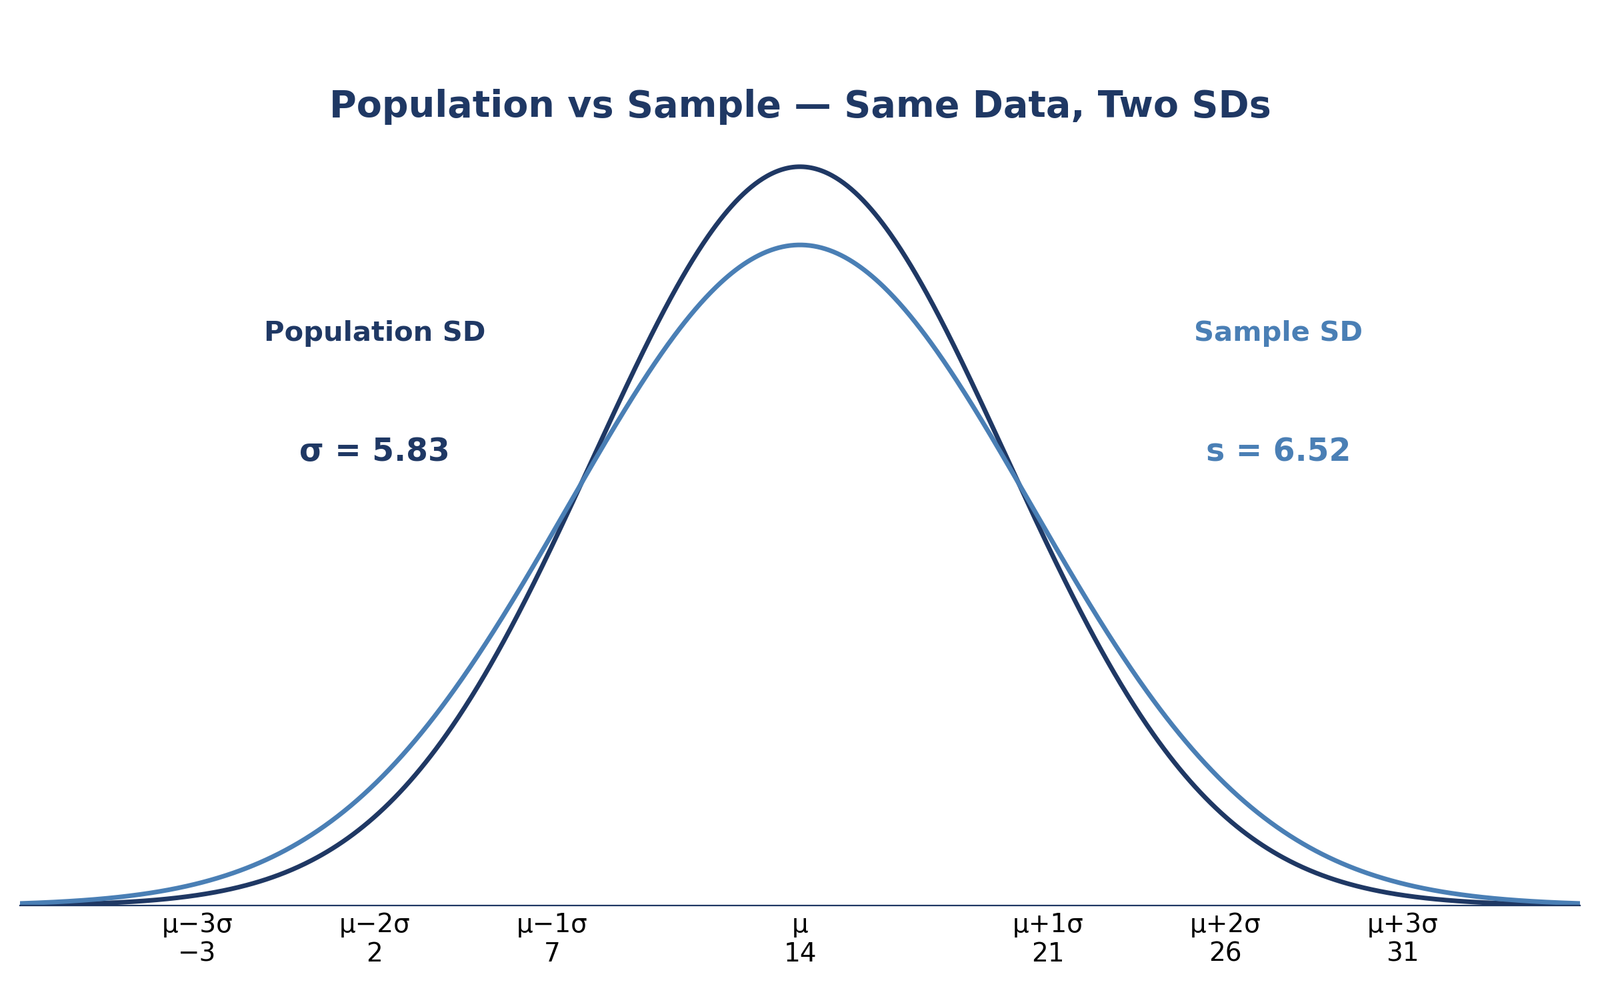
The picture makes the numbers visible. Both curves are centred on 14, but the sample curve is wider and flatter: a larger standard deviation spreads the same data further from the mean. You can see the same effect for any data set when you shade the area under a bell curve within one, two or three standard deviations of the mean. As a check, enter 10, 5, 20, 15 and 20 into our calculator and confirm it gives σ = 5.83 and s = 6.52.
A Second Worked Example: 10, 12, 13, 15, 20
Here is a second data set, worked the same way, so you can practise the pattern: 10, 12, 13, 15, 20.
Step 1 — Find the mean. 10 + 12 + 13 + 15 + 20 = 70, and 70 ÷ 5 = 14. The mean is 14 again.
| Value (x) | Deviation (x − 14) | Squared deviation |
|---|---|---|
| 10 | −4 | 16 |
| 12 | −2 | 4 |
| 13 | −1 | 1 |
| 15 | +1 | 1 |
| 20 | +6 | 36 |
Step 2 — Add the squared deviations. 16 + 4 + 1 + 1 + 36 = 58. The deviations sum to 0, as expected.
Population: variance = 58 ÷ 5 = 11.60, so σ = √11.60 = 3.406.
Sample: variance = 58 ÷ 4 = 14.50, so s = √14.50 = 3.808.
Notice the pattern from the first example repeats: the same sum of squared deviations, a smaller divisor for the sample, and a larger result. These numbers are also less spread out than the first data set, so both standard deviations (3.406 and 3.808) are smaller than the first example's (5.83 and 6.52).
Why the Sample Standard Deviation Is Always Bigger
For the same data, the sample standard deviation is always bigger than the population standard deviation, because the two calculations share the same numerator and the sample uses the smaller denominator. The sum of squared deviations is identical; dividing it by n − 1 instead of N gives a larger variance, and the square root of a larger variance is larger.
The size of the gap depends only on n. The ratio is s ÷ σ = √(N ÷ (N − 1)).
| Sample size (n) | Ratio s ÷ σ | How much bigger the sample SD is |
|---|---|---|
| 5 | √(5 ÷ 4) = 1.118 | 11.8% bigger |
| 10 | √(10 ÷ 9) = 1.054 | 5.4% bigger |
| 30 | √(30 ÷ 29) = 1.017 | 1.7% bigger |
| 100 | √(100 ÷ 99) = 1.005 | 0.5% bigger |
Check it against the first example: 6.52 ÷ 5.83 = 1.118, exactly the ratio for n = 5. With small samples the choice matters a lot; with big samples the gap nearly vanishes, which is why the population-versus-sample question is most important when n is small.
Bessel's correction is the name for dividing by n − 1 instead of n when you calculate a sample variance or sample standard deviation. It is named after the astronomer Friedrich Bessel, who described the correction in the 19th century.
The correction is needed because the sample mean sits inside the data. Deviations measured from the sample mean are, on average, smaller than deviations measured from the true population mean, because the sample mean is chosen to sit in the middle of that very sample. If you divided by n, you would systematically under-estimate the population variance. Dividing by the slightly smaller n − 1 inflates the result just enough to correct that under-estimate, so the sample variance becomes an unbiased estimate of the population variance.
The formal definitions behind these formulas are set out in the NIST/SEMATECH e-Handbook of Statistical Methods.
The n − 1 comes from degrees of freedom: the number of values that are free to vary once something else is fixed. When you calculate a sample variance, you first calculate the sample mean, and that fixes one thing about the data.
Take the first example: five values with a mean of 14. The five deviations from the mean must add up to 0. That means you can choose the first four deviations freely, but the fifth is then forced: it must be whatever makes the total zero. Only four deviations are free, so there are n − 1 = 4 degrees of freedom, and you divide by 4. In general, once the mean is fixed, n − 1 values are free and the last one is determined, which is why the sample variance divides by n − 1 and not by n.
When to Use Sample Standard Deviation
Use the sample standard deviation whenever you have only part of a larger group, or whenever you are using that part to say something about the whole group. That covers most real work: surveys, experiments, quality checks and any study where measuring everyone is impossible or impractical.
- You surveyed 200 voters and want to describe all voters.
- You tested 50 batteries and want to estimate the life of all batteries of that type.
- You are running a test or building a confidence interval, where the sample is standing in for the population.
Use the population standard deviation when you have every value and you are describing only those values, with no attempt to generalise beyond them: a complete class list, a full census, every item in a small batch. If your data are the whole group, there is nothing to estimate, so there is no correction to apply.
Which Standard Deviation to Use
The direct answer: if you have every value in the group, use the population standard deviation (σ, divide by N). If you have only some of the values, or you are using a sample to estimate the population, use the sample standard deviation (s, divide by n − 1). When you are unsure, ask which group your conclusion is about. If the conclusion is about the people or items you actually measured and nobody else, it is a population. If the conclusion is about a larger group you did not fully measure, it is a sample.
Once you have the right standard deviation, you can use it to describe a normal distribution. A bell curve generator draws the curve for your mean and standard deviation, and an empirical rule graph generator shows the 68-95-99.7 percentages. If your data are not bell-shaped, the empirical rule does not apply, and you should compare the empirical rule with Chebyshev's theorem instead.
Tool Defaults: Which Standard Deviation Does Your Tool Give You?
Different tools give different answers for the same data, because their defaults differ. This is the trap that catches most people: NumPy and pandas, for example, disagree by default. Always check which version your tool returns before you use the number.
| Tool | Default result | Divides by |
|---|---|---|
| Excel =STDEV.P(range) | Population | N |
| Excel =STDEV.S(range) | Sample | n − 1 |
| TI-84 σx | Population | N |
| TI-84 Sx | Sample | n − 1 |
| NumPy np.std() | Population (ddof = 0) | N |
| NumPy np.std(ddof = 1) | Sample | n − 1 |
| pandas .std() | Sample (ddof = 1) | n − 1 |
| pandas .std(ddof = 0) | Population | N |
| R sd() | Sample | n − 1 |
| Python statistics.stdev() | Sample | n − 1 |
| Python statistics.pstdev() | Population | N |
| Our Standard Deviation Calculator | Both σ and s | Shows both |
The NumPy-versus-pandas trap, checked against the current documentation on 9 November 2026: NumPy 2.5 documents np.std with ddof = 0 by default, so it returns the population value, 5.83 for our example data. pandas 3.1.1 documents Series.std with ddof = 1 by default, so it returns the sample value, 6.52, for the same data. Both answers are correct for their own definition, and the only way to know which you have is to check the default, or set ddof yourself.
Population vs Sample Standard Deviation Practice
Decide whether each scenario needs the population or the sample standard deviation, then check your answers below.
- You have the salaries of all 500 employees in a company. Which standard deviation?
Answer: POPULATION. You have the whole group, so divide by N = 500. - You survey 30 of the 500 employees and want to describe all 500. Which standard deviation?
Answer: SAMPLE. You have only some of the group and you are estimating the population, so divide by n − 1 = 29. - You have the test scores of an entire class of 25 students. Which standard deviation?
Answer: POPULATION. The class is the whole group you are describing, so divide by N = 25. - You test 100 light bulbs out of a production run of 10,000. Which standard deviation?
Answer: SAMPLE. The 100 bulbs are a sample of the 10,000, so divide by n − 1 = 99.
If any of these felt tricky, go back to the one-question rule: Do I have every value in the group, or only some of them? Every value means population; only some means sample.
Common Mistakes to Avoid
- Using the population formula on sample data. This is the most common mistake. It under-states the spread, because dividing by n instead of n − 1 gives a smaller value.
- Using the sample formula on a whole population. This over-states the spread. If you measured everyone, there is nothing to estimate and no correction is needed.
- Mixing up σx and Sx on a TI-84. σx is the population value and Sx is the sample value. Picking the wrong one silently changes your answer.
- Assuming np.std() gives a sample value. It does not: NumPy defaults to ddof = 0, the population value, while pandas defaults to ddof = 1, the sample value.
- Reporting a standard deviation without saying which one. Always label σ or s, and say whether the data are a population or a sample, so a reader can reproduce your number.
One more useful check: if a single value is driving most of the spread, you can see exactly how much with the SD percentage contribution calculator, which breaks down how each standard deviation contributes as a percentage of the total.
Frequently Asked Questions
What is the difference between population and sample standard deviation?
The population standard deviation (σ) describes the spread of a whole group and divides the sum of squared deviations by N, the number of values. The sample standard deviation (s) describes a sample and divides by n − 1, which makes it a little larger for the same data. Use the population value when you have every value, and the sample value when you have only some of them.
When should I use the sample standard deviation instead of the population standard deviation?
Use the sample standard deviation when your data are only part of a larger group, or when you are using the sample to estimate the population value. If you have every value in the group, use the population standard deviation instead.
Why is n−1 used in the sample variance?
Dividing by n − 1 is Bessel's correction. A sample mean sits inside the data, so deviations from it are smaller on average than deviations from the true population mean. Dividing by n − 1 instead of n corrects that under-estimate. It also reflects the degrees of freedom: once the mean is fixed, only n − 1 deviations are free to vary.
Is the sample standard deviation always bigger than the population standard deviation?
Yes, for the same set of numbers. Both use the same sum of squared deviations, but the sample version divides by the smaller number n − 1, so its variance and its standard deviation are larger. The ratio is s ÷ σ = √(N ÷ (N − 1)): for n = 5 it is 1.118, and for n = 100 it is only 1.005.
What is Bessel's correction?
Bessel's correction is dividing by n − 1 instead of n when you calculate a sample variance or sample standard deviation. It corrects the under-estimate that comes from using the sample mean, which sits inside the data, instead of the true population mean.
How do I calculate the population standard deviation?
Find the mean, subtract the mean from each value, square each deviation, add the squared deviations, divide by N, the number of values, and take the square root. For 10, 5, 20, 15 and 20, the mean is 14, the sum of squared deviations is 170, the population variance is 34.00 and the population standard deviation is 5.83.
Which standard deviation does Excel use by default?
Excel does not pick one for you: you must choose. Use =STDEV.P(range) for a population and =STDEV.S(range) for a sample. The older STDEVP and STDEV functions do the same jobs, but STDEV.P and STDEV.S are the ones to use in new work.
Can I use the sample standard deviation for a whole population?
You can calculate it, but you should not report it as the population value. For a whole population the sample formula divides by n − 1 instead of N, so it overstates the spread. Use the population standard deviation when you have every value.
Check Tools
Standard Deviation Calculator
Calculate the mean, variance, population standard deviation (σ) and sample standard deviation (s) for any data set.
ToolsTry Calculator →● LiveStandard Deviation Shading Tool
Visualise which values fall within one, two or three standard deviations of the mean on a bell curve.
ToolsTry Calculator →● LiveSD Percentage Contribution Calculator
See how much each value contributes to the total standard deviation, as a percentage.
ToolsTry Calculator →● LiveBell Curve Generator
Generate a labelled bell curve from a mean and standard deviation, and download it as an image.
ToolsTry Calculator →● LiveZ-Score Calculator
Convert any value to a z-score, or turn a z-score back into a raw value.
ToolsTry Calculator →● LiveExplore All Statistical Tools
Browse the complete collection of free statistical tools and calculators on one page.
ToolsTry Calculator →Check Articles
How to Calculate Standard Deviation
How to calculate standard deviation: find the mean, subtract the mean from each value and square each result, add the squared deviations, then divide by N for a population (or by n − 1 for a sample) and take the square root.
ArticleRead Article →● LiveHow to Calculate a Z-Score
Learning how to calculate a z score is the key to reading any normal distribution.
ArticleRead Article →● LiveHow to Read a Z-Table
Learning how to read a z table is one of the fastest skills in statistics: once you can read one row and one column, you can turn any z-score into a probability in seconds.
ArticleRead Article →● LiveNormal Distribution Examples
These normal distribution examples show how the bell curve works in real life — with a mean, a standard deviation, and an exact probability for every case.
ArticleRead Article →● LiveStandard Normal Distribution
The standard normal distribution is the one normal distribution every other normal distribution can be turned into.
ArticleRead Article →● LiveWhat is the Empirical Rule?
It is the statistical rule, also called the 68-95-99.7 rule, that in a normal distribution 68.27% of values lie within one standard deviation of the mean, 95.45% within two standard deviations and 99.73% within three.
ArticleRead Article →