
P-value vs z-score — which number should you look at first? If you have ever finished a z-test and stared at two numbers, you are not alone. The z-score and the p-value describe the same result in two different languages, and confusing them is one of the most common mistakes in statistics.
A z-score tells you how many standard deviations a value sits from the mean. A p-value tells you how surprising that distance is if the null hypothesis were true. In short: the z-score is the distance, and the p-value is the decision number you compare with your significance level α. This guide explains the difference between p-value and z-score, shows how to convert z-score to p-value with a table, works one complete z-test with both one- and two-tailed p-values, and gives a six-step workflow you can reuse for any z-test.
Use the tool to calculate a p-value from a z-score to check any value in this guide in seconds, or keep reading to learn the table method by hand.
The short answer: a z-score measures distance, and a p-value measures surprise. They come from the same test, but they answer different questions. A z-score says how far a result is from what the null hypothesis expects. A p-value says how likely a result at least that far away would be if the null hypothesis were true. You need the first to get the second, and you need the second to make a decision.
| Z-Score | P-Value | |
|---|---|---|
| What it is | How many standard deviations a value sits from the mean | The probability of data at least this extreme if H₀ is true |
| Range | Any real number, for example +2.93 | Always 0 to 1, for example 0.0034 |
| What it tells you | Distance and direction from the mean | How surprising the result is under H₀ |
| How it is used | To standardize a value and find its percentile or rank | To compare with α and decide whether to reject H₀ |
| Interpreting it | Needs the normal table, Φ(z), to interpret | Compares directly with α, usually 0.05 |
| Role in a test | The input: the standardized distance | The output: the decision number |
Report both numbers in a test result. The z-score shows how far the result is, and the p-value shows how surprising it is. A large z-score with a tiny p-value is strong evidence against H₀; a z-score near zero with a large p-value is not. If you are new to either number, start with our guide to how to calculate a z-score and our explanation of what a p-value is.
How to Convert Z-Score to P-Value
To convert a z-score to a p-value, look up Φ(z), the area under the standard normal curve to the left of z. For a positive z, the one-tailed p-value is 1 − Φ(z), and the two-tailed p-value is 2 × (1 − Φ(z)). For a negative z, use its absolute value: the two-tailed p-value is the same. You can do this with a z-table, with our p-value calculator from z-score, or with the table below.
Z-Score to P-Value Table
| Z-Score | One-Tailed p | Two-Tailed p |
|---|---|---|
| 1.00 | 0.1587 | 0.3173 |
| 1.65 | 0.0495 | 0.0989 |
| 1.96 | 0.0250 | 0.0500 |
| 2.58 | 0.0049 | 0.0099 |
| 3.00 | 0.0013 | 0.0027 |
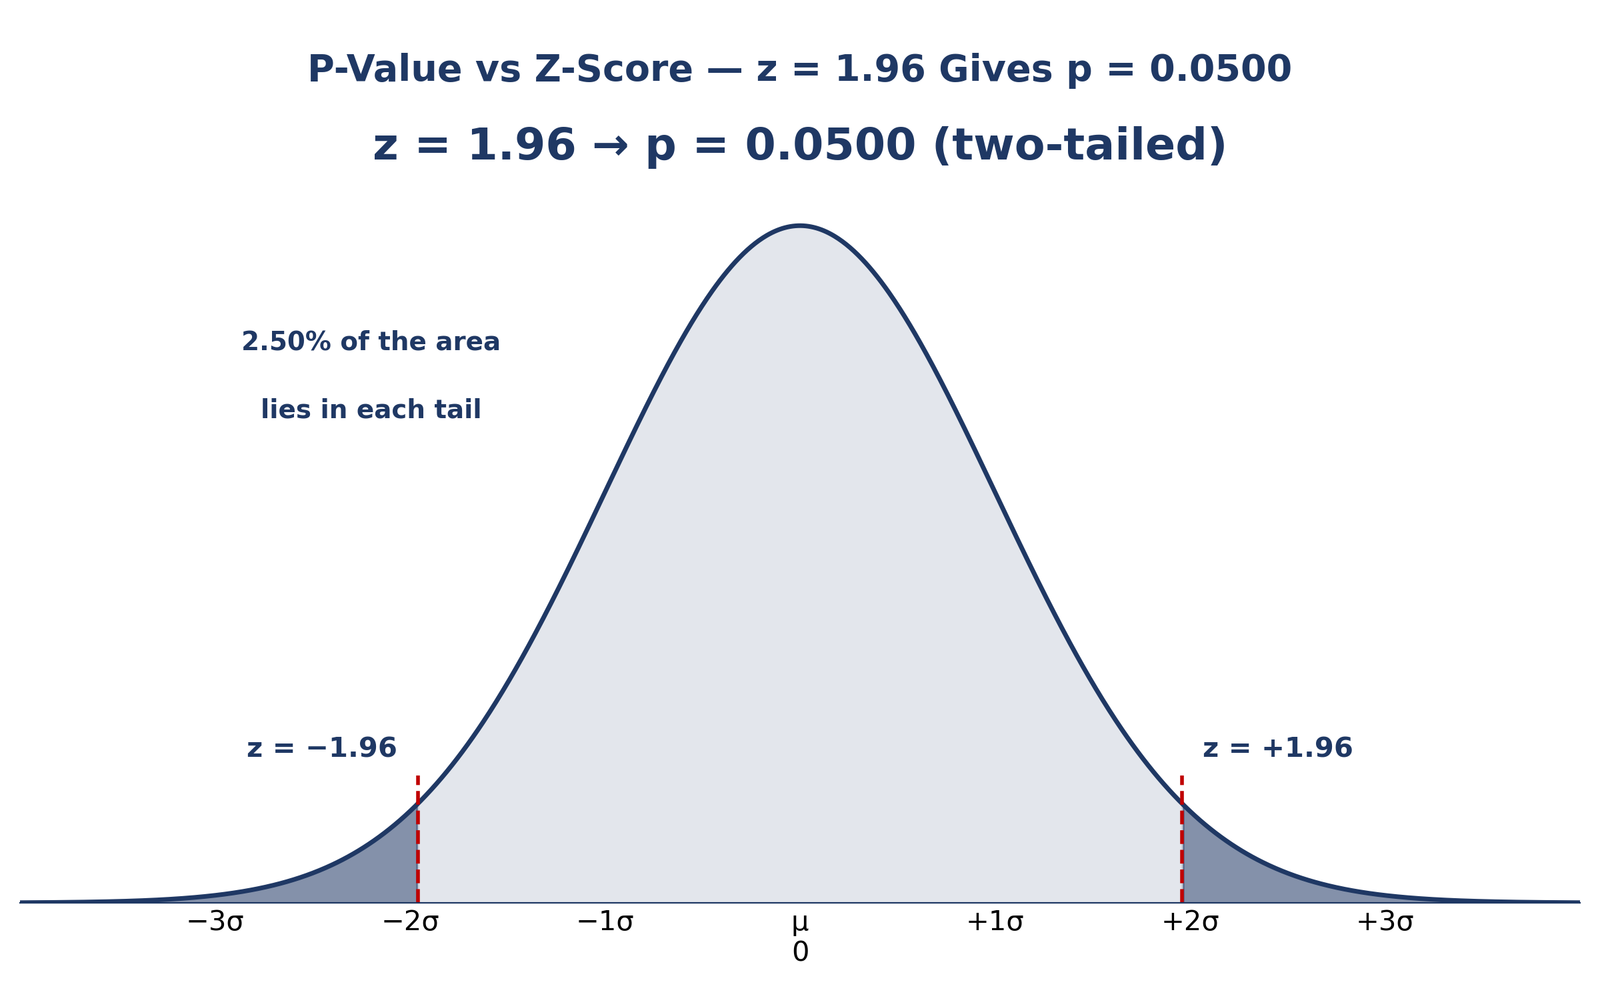
How to read the table: a z-score of 1.96 leaves 0.0250 in the upper tail, so the two-tailed p-value is 0.0250 + 0.0250 = 0.0500. That is the familiar 5% cutoff: z = ±1.96 is the boundary of significance at α = 0.05. A z-score of 2.58 gives a two-tailed p-value of 0.0099, just under 0.01. If you want the full table method, see our guide to reading a z-table.
P-Value vs Z-Score Example: One Worked Z-Test
Here is one complete example, with both one- and two-tailed p-values from the same z-score, so you can see exactly how the two numbers relate. A researcher tests whether a sample of 25 students has a mean IQ different from 100. The population standard deviation is 15, and the sample mean is 108.8.
Hypotheses. H₀: μ = 100. H₁: μ ≠ 100 (a two-tailed test). Significance level α = 0.05.
Step 1 — Standard error. SE = σ / √n = 15 / √25 = 15 / 5 = 3.00.
Step 2 — Z-score. z = (x̄ − μ₀) / SE = (108.8 − 100) / 3.00 = 8.8 / 3.00 = +2.93. The sample mean sits 2.93 standard deviations above the hypothesised mean.
Step 3 — P-value. From the standard normal table, Φ(2.93) = 0.9983, so the upper-tail area is 1 − 0.9983 = 0.0017. One-tailed p = 0.0017. Two-tailed p = 2 × 0.0017 = 0.0034.
Step 4 — Decision. The two-tailed p-value 0.0034 is less than α = 0.05, and it is also less than 0.01, so we reject H₀ at both levels. The result is statistically significant: a sample mean of 108.8 is too far from 100 to be plausibly explained by chance alone. Check the arithmetic with our z-score calculator and the normal distribution calculator.
A note on the z-values. The worked IQ example on the Normal Distribution Examples page uses the same distribution (mean 100, SD 15) but a different question: a single score of 130 gives z = +2.00 because it is standardised with the standard deviation (σ = 15). The worked example above standardises a sample mean of 108.8 from 25 people, so it uses the standard error (σ/√n = 3) and gives z = +2.93. Both z-values are correct; they differ because the divisor differs, not because either example is wrong.
When to Use Z-Score vs P-Value
Use the z-score when you need the distance, percentile or rank of a value — for example, how unusual one test score is, or where a value falls in the standard normal distribution. Use the p-value when you are testing a hypothesis against a significance level α — for example, deciding whether a new teaching method really raised scores. In a test result, always report both: the z-score shows the size of the result in standard-deviation units, and the p-value shows how surprising it is. You can plot your result with the z-score graph plotter to see exactly where it falls on the curve.
How to Use P-Value and Z-Score Together: A 6-Step Workflow
- State H₀ and H₁. Write the null hypothesis and the alternative, and decide whether the test is one- or two-tailed.
- Choose α, usually 0.05. Pick your significance level before you look at the data.
- Compute the z-score. Standardize your result: z = (value − mean) / standard deviation, or use the standard error for a sample mean.
- Convert the z-score to a p-value. Use the z-score to p-value table above or a calculator.
- Compare p with α. If p is smaller than α, the result is statistically significant.
- Decide and report the effect size. Reject H₀ or fail to reject it, and report the z-score and the size of the effect alongside the p-value.
No. A z-score is a standardized distance: how many standard deviations a value sits from the mean. It can be any real number, positive or negative. A p-value is a probability: how likely data at least this extreme would be if the null hypothesis were true. It is always between 0 and 1. You convert the first into the second, but they are not the same number and they are not interchangeable. To find a z-score, you need the mean and the standard deviation of the distribution.
For a z-score of 1.96, the one-tailed p-value is 0.0250 and the two-tailed p-value is 0.0500. That is why 1.96 is the critical value at α = 0.05 for a two-tailed z-test: a result at or beyond ±1.96 is significant at the 5% level, and anything inside that range is not.
Look up Φ(z) in a standard normal table, subtract it from 1 to get the one-tailed p-value, and double it for the two-tailed p-value. For example, z = 2.58 gives Φ(2.58) = 0.9951, so the one-tailed p-value is 0.0049 and the two-tailed p-value is 0.0099. The table above gives the most common values, and a calculator does the same lookup instantly.
Frequently Asked Questions
What is the difference between p-value and z-score?
A z-score measures how many standard deviations a value sits from the mean, while a p-value measures the probability of data at least this extreme if the null hypothesis is true. The z-score is the input to the test; the p-value is the output you compare with α.
How do I convert a z-score to a p-value?
Look up Φ(z) in a standard normal table, then use 1 − Φ(z) for a one-tailed p-value and 2 × (1 − Φ(z)) for a two-tailed p-value. For example, z = 1.96 gives a two-tailed p-value of 0.0500.
Is the p-value the same as the z-score?
No. A z-score is a standardized distance and can be any real number; a p-value is a probability and is always between 0 and 1. You convert a z-score into a p-value, but the two numbers are not the same thing.
What is the p-value for z = 1.96?
The p-value for z = 1.96 is 0.0250 one-tailed and 0.0500 two-tailed. That is why 1.96 is the critical value at α = 0.05 for a two-tailed z-test.
When should I use a z-score instead of a p-value?
Use a z-score when you need a distance, percentile or rank for a value. Use a p-value when you are testing a hypothesis against a significance level α. In a test result, report both.
How do I find the p-value from a z-score in a table?
Find the row for your z-score, read Φ(z), subtract it from 1 to get the one-tailed p-value, and double it for the two-tailed p-value. The table on this page gives the most common values.
What does a p-value of 0.0034 mean?
In the worked example on this page, a two-tailed p-value of 0.0034 means that, if the null hypothesis were true, data at least this extreme would occur only 0.34% of the time. Because 0.0034 is less than 0.05 and less than 0.01, we reject the null hypothesis at both levels.
Can a p-value be larger than 1?
No. A p-value is a probability, so it is always between 0 and 1. A z-score, by contrast, can be any real number: a very unusual value can have a z-score of 3, 4 or more.
Check Tools
P-Value Calculator from Z-Score
Find the p-value from a z-score in seconds, one- or two-tailed.
ToolsTry Calculator →● LiveZ-Score Calculator
Work out a z-score from a raw value, the mean and the standard deviation.
ToolsTry Calculator →● LiveNormal Distribution Calculator
Find probabilities and percentiles for any normal distribution.
ToolsTry Calculator →● LiveZ-Score Graph Plotter
Plot a z-score on the standard normal curve and see its tails.
ToolsTry Calculator →● LiveStandard Deviation Calculator
Find the standard deviation you need before you compute a z-score.
ToolsTry Calculator →● LiveExplore All Statistical Tools
Browse all 29 free statistical tools in one place.
ToolsTry Calculator →Check Articles
What Is a P-Value
A p-value is the probability of getting results at least as extreme as the ones you observed, assuming the null hypothesis is true.
ArticleRead Article →● LiveHow to Calculate a Z-Score
Learning how to calculate a z score is the key to reading any normal distribution.
ArticleRead Article →● LiveHow to Read a Z-Table
Learning how to read a z table is one of the fastest skills in statistics: once you can read one row and one column, you can turn any z-score into a probability in seconds.
ArticleRead Article →● LiveStandard Normal Distribution
The standard normal distribution is the one normal distribution every other normal distribution can be turned into.
ArticleRead Article →● LiveWhat Is Margin of Error
It is the ± number printed after a survey result — the radius of the confidence interval around that result.
ArticleRead Article →● LiveMargin of Error vs Confidence Interval
The margin of error vs confidence interval question comes down to this: the margin of error is the ± number, and the confidence interval is the range that number creates.
ArticleRead Article →